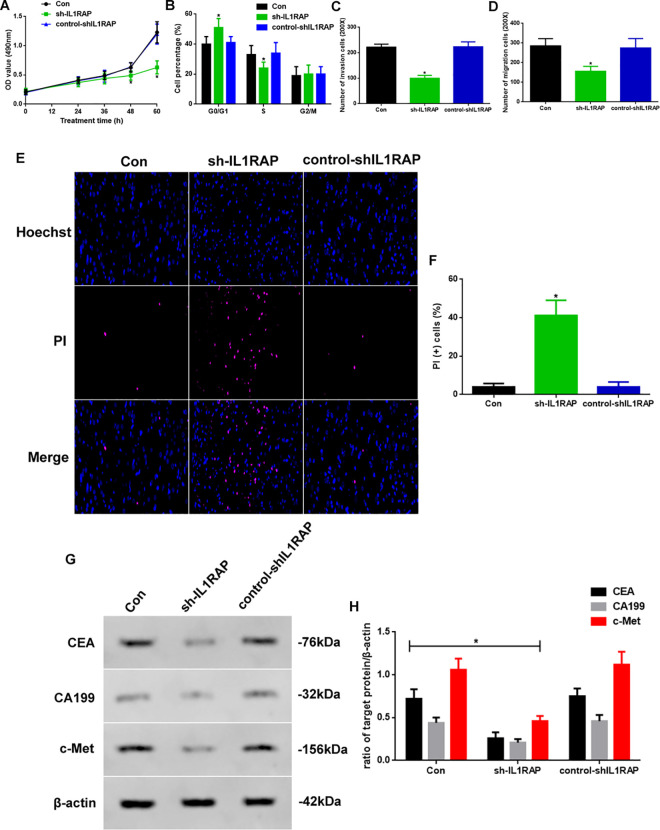
Figure 3.
(A) Proliferation assay in 72 hours, (B) Cell cycle assay, (C) Migration assay and (D) Invasion assay at 60 hours of Con, sh-IL1RAP, and control-shIL1RAP group. (E) PI-Hoechst staining assay (×400) of apoptosis and (F) PI (+) cell assay. (G) Western blot assay of CEA, CA199 and c-Met expression in vitro. (H) Quantification of CEA, CA199, and c-Met expression. Protein levels were normalized to β-actin (sh-IL1RAP vs. other group, * P < 0.05, n = 6 per group).

