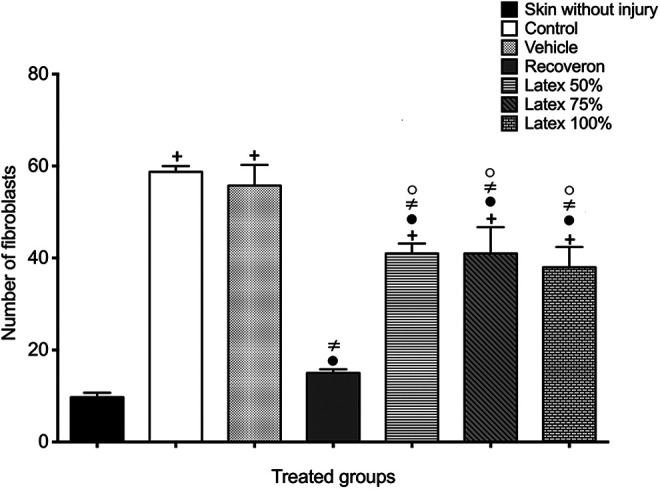
Figure 2.

Active fibroblasts in the experimental groups of normal mice (Mean ± S.E.M., n = 6). +Significant difference compared to the skin without injury group (P < 0.05). •Significant difference compared to the control group (P < 0.05). ≠Significant difference compared to the vehicle group (P < 0.05). (o)Significant difference compared to the Recoveron group (P < 0.05).
