
Figure 4.
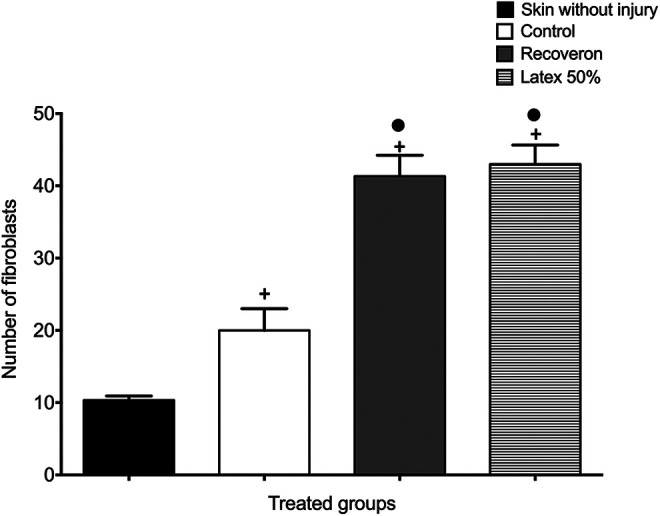
Active fibroblasts in each experimental group of diabetic mice (Mean ± S.E.M., n = 6). +Significant difference compared to the skin without wound group (P < 0.05). •Significant difference compared to the control group (P < 0.05).
Official websites use .gov
A
.gov website belongs to an official
government organization in the United States.
Secure .gov websites use HTTPS
A lock (
) or https:// means you've safely
connected to the .gov website. Share sensitive
information only on official, secure websites.
Active fibroblasts in each experimental group of diabetic mice (Mean ± S.E.M., n = 6). +Significant difference compared to the skin without wound group (P < 0.05). •Significant difference compared to the control group (P < 0.05).