Figure 1.
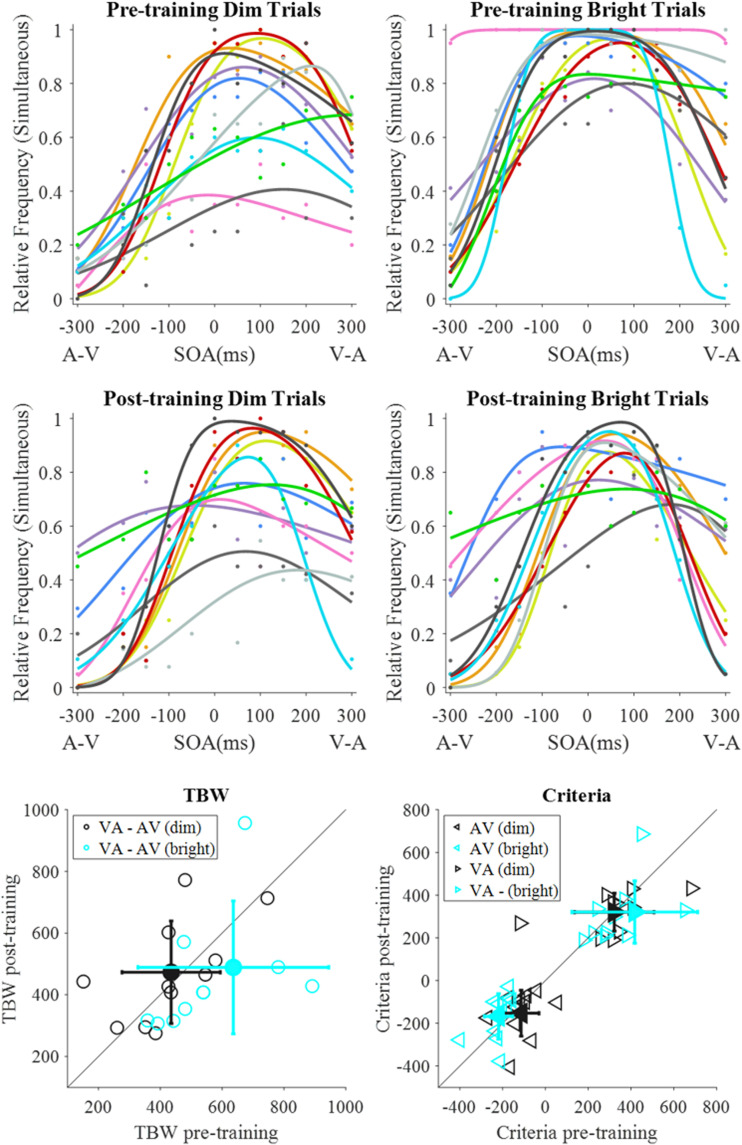
Bright training group data (n = 11). Rows 1 and 2 contain fits for the pretraining (row 1) and posttraining (row 2) data for the dim (left column) and bright (right column) stimuli. Each colour represents an individual observer. Row 3 consists of scatterplots of individual data, alongside means (filled-in markers) and standard deviations (error bars). Row 3 (left) represents pre- and posttraining TBW sizes, calculated as the difference between the two criteria (VA – AV), where data points below the reference line indicate a smaller TBW after training. Row 3 (right) represents the placement of the AV and VA criteria, whereby values above the reference line for the AV criterion and below the line for the VA criterion indicate a shift towards physical simultaneity following training. One data point is not shown in both scatterplots (row 3).
AV = audio-leading; SOA = stimulus offset asynchrony; VA = visual-leading; TBW = temporal binding window.

