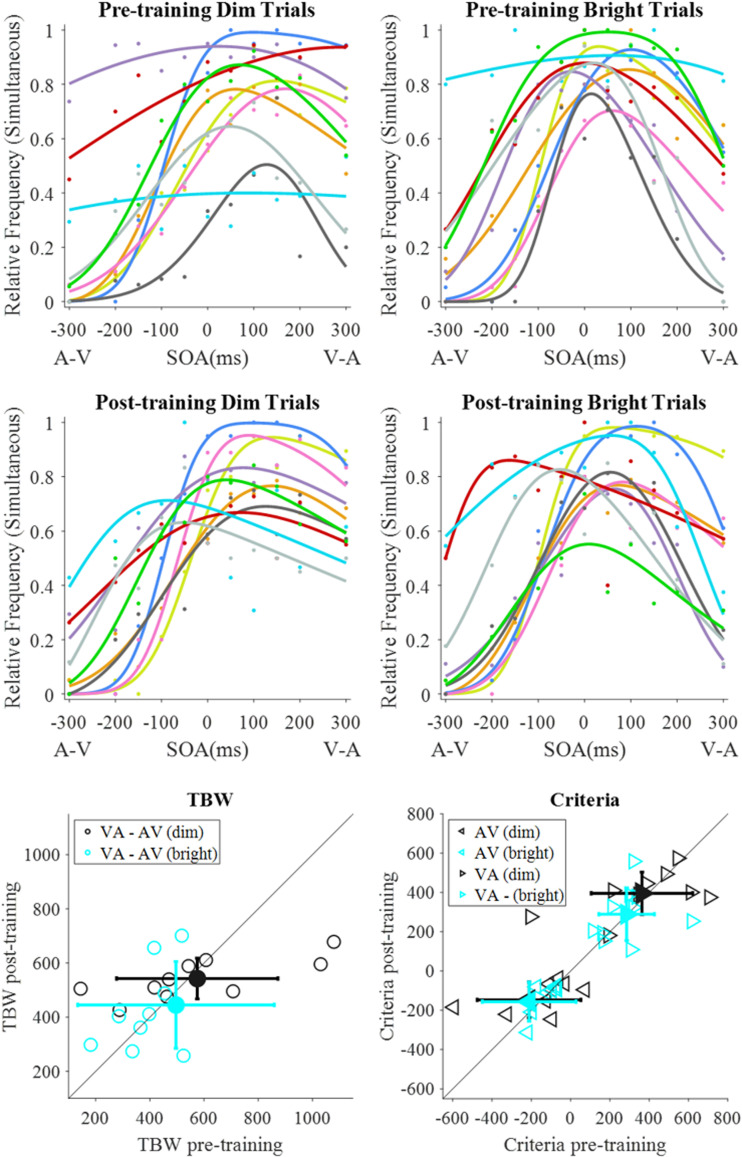
Figure 2.
Dim training group (n = 10). Rows 1 and 2 consist of the individual observer fits. Row 3 contains scatterplots of the pre- and posttraining TBW size (left; one data point is not shown) and criteria placement (right).
AV = audio-leading; SOA = stimulus offset asynchrony; VA = visual-leading; TBW = temporal binding window.

