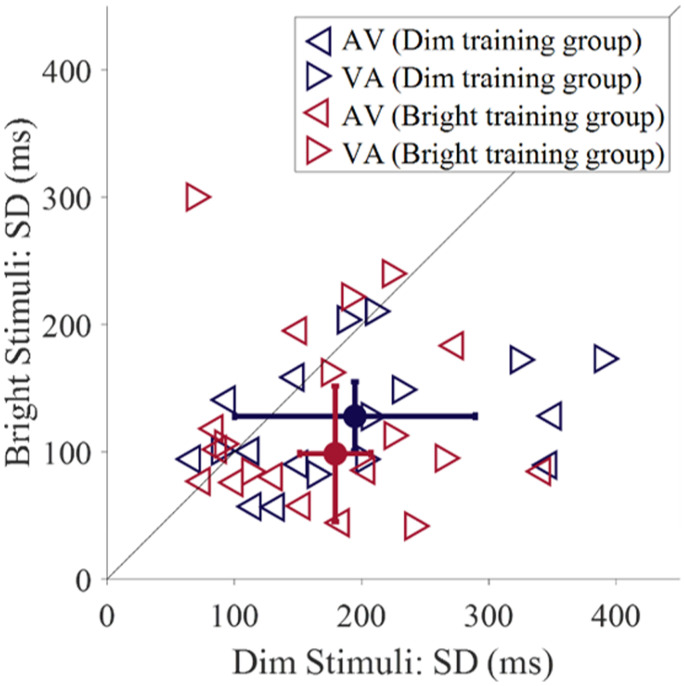
Figure 3.
The SDs of the fitted Gaussians for audio-leading (AV) and visual-leading (VA) pretraining data, across all observers (n = 21). Filled-in circles and error bars represent the median and standard errors, taken across both the AV and VA fits, for the dim (purple) and bright (maroon) training groups. Three data points (> 450) are not shown.
AV = audio-leading; VA = visual-leading.

