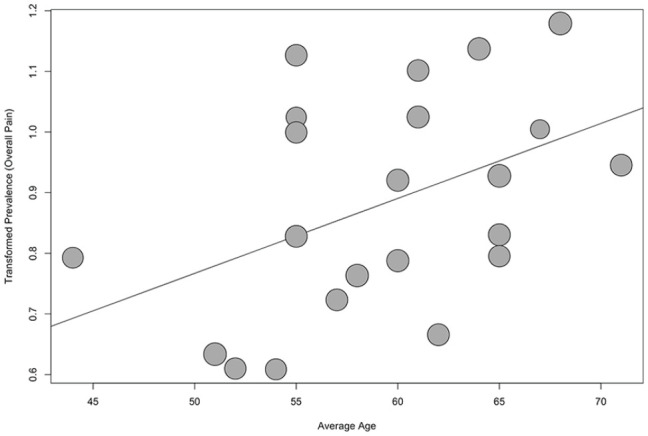
Figure 4.

Bubble plot of transformed prevalence of overall pain against average age for patients on hemodialysis.
Note. Regression line plotted (P = .02), one study omitted due to missing age reporting.

Bubble plot of transformed prevalence of overall pain against average age for patients on hemodialysis.
Note. Regression line plotted (P = .02), one study omitted due to missing age reporting.