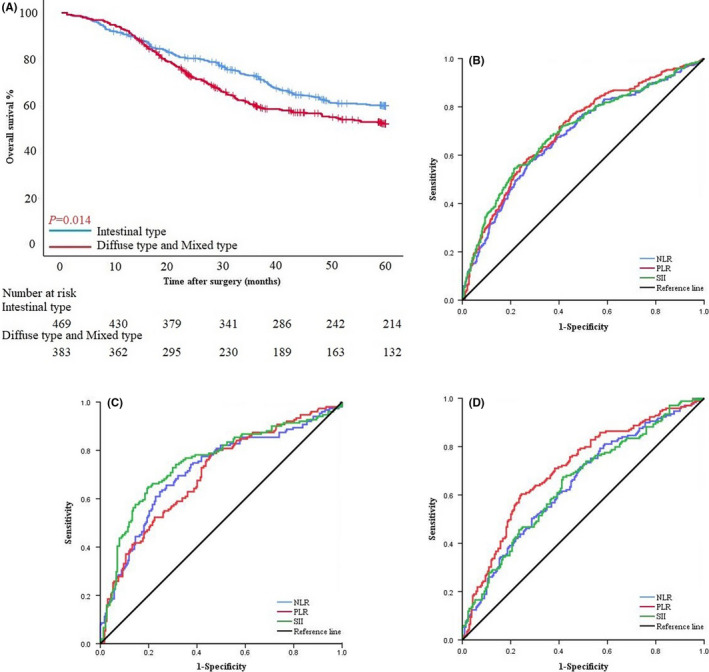
FIGURE 1.

(A) Survival curves based on patients with intestinal type and diffuse/mixed type before PSM. (B) ROC curve of NLR, PLR, and SII among all patients in PSM cohort. (C) ROC curve of NLR, PLR, and SII of patients with intestinal type. (D) ROC curve of NLR, PLR, and SII of patients with diffuse/mixed type.
