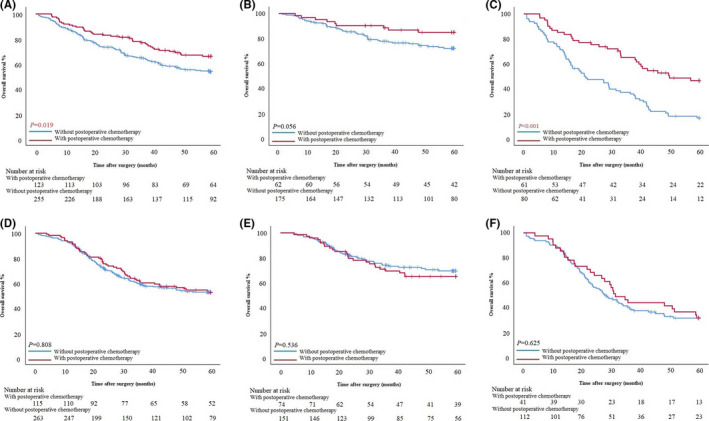
FIGURE 4.

(A–C) Survival curves based on with and without postoperative chemotherapy in all, SII≤529.60 and SII>529.60 intestinal type GC patients. (D–F) Survival curves based on with and without postoperative chemotherapy in all, PLR≤126.90 and PLR>126.90 diffuse/mixed type GC patients.
