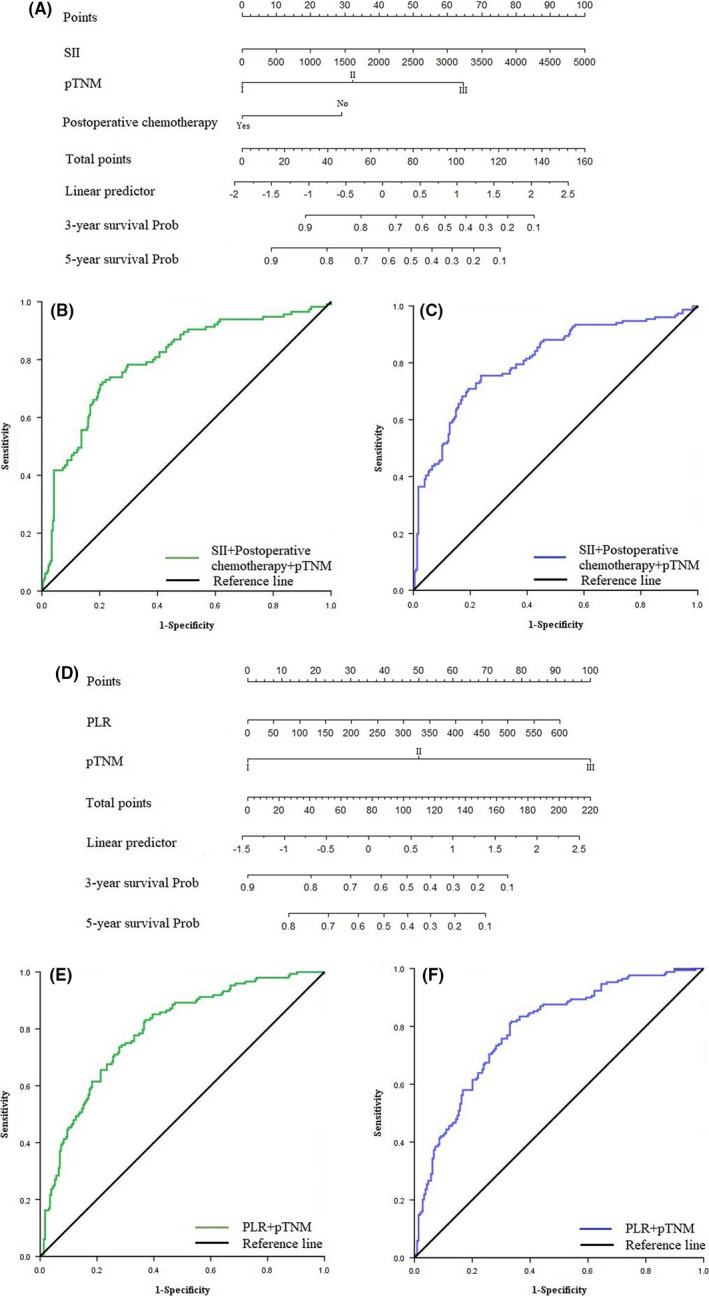
FIGURE 5.

(A) Nomogram model predicting 3‐ and 5‐year survival of patients with intestinal type GC. (B) ROC curve of nomogram model predicting 3‐year survival of patients with intestinal type GC. (C) ROC curve of nomogram model predicting 5‐year survival of patients with intestinal type GC. (D) Nomogram model predicting 3‐ and 5‐year survival of patients with diffuse/mixed type GC. (E) ROC curve of nomogram model predicting 3‐year survival of patients with diffuse/mixed type GC. (F) ROC curve of nomogram model predicting 5‐year survival of patients with diffuse/mixed type GC.
