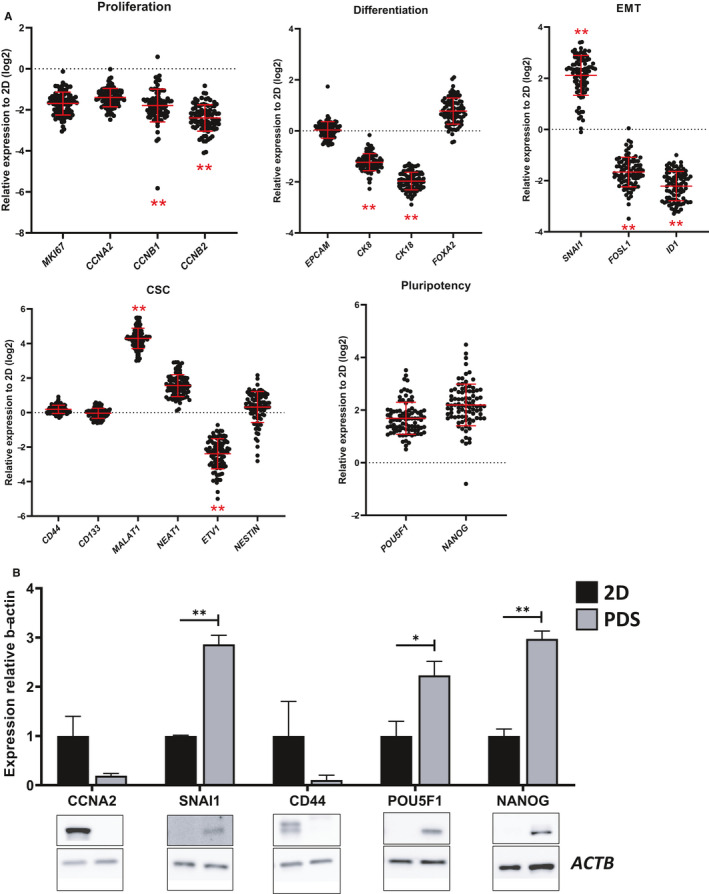
Figure 4.

Colorectal PDS‐induced gene and protein changes in HT29 cells. (A) Gene expression fingerprint of HT29 cells (determined with qPCR) after 3 weeks growth on colorectal PDS. Data are expressed relative to 2D expression levels. Red bars indicate mean ±SD (n = 89). Dots indicate individual patients. *p < 0.05; **p < 0.01 (2D vs. PDS, Mann–Whitney U test). (B) Protein expression (determined with western blot) in PDS‐grown HT29 cells relative to 2D grown cells. Values represent mean ±SEM (SNAI1, NANOG: n = 3; CCNA2, CD44, POU5F1: n = 4), *p < 0.05; **p < 0.01 (unpaired Student's t‐test)
