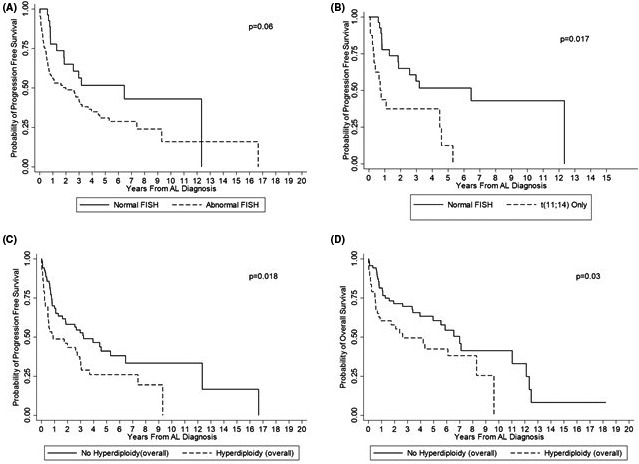
FIGURE 2.

Kaplan–Meier survival estimates based on FISH abnormalities. (a) Progression‐free survival based on the presence or absence of any FISH abnormality. (b) Progression‐free survival comparing presence t(11;14) to normal FISH. (c) Progression‐free survival by presence or absence of hyperdiploidy. (d) Overall survival by presence or absence of hyperdiploidy
