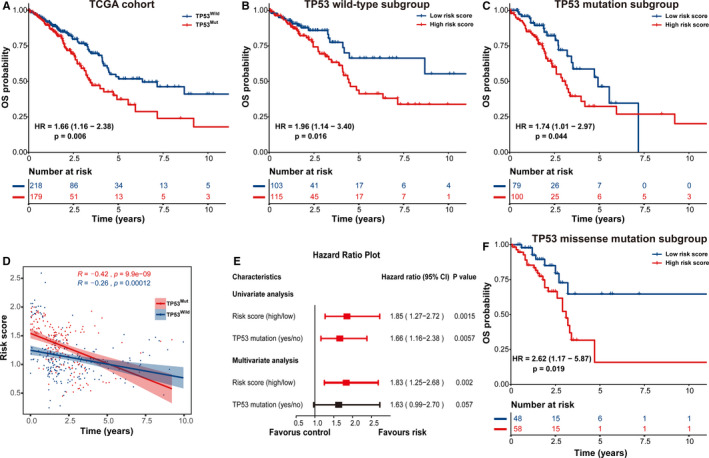
Figure 5.

Prognostic analysis of early‐stage lung adenocarcinoma (LUAD) patients in multiple subgroups stratified by TP53 status. Kaplan–Meier curves of the overall survival (OS) difference between high‐ and low‐risk cases in (A) the whole TCGA cohort, (B) TP53WT subgroup and (C) TP53MUT subgroup. (D) Correlation analysis between immune prognostic model (IPM) risk score and patient's OS. (E) Univariate and multivariate Cox regression analysis of the prognostic association between an IPM and TP53 status. (F) Kaplan–Meier curves of the OS difference between high‐ and low‐risk patients in the TP53 missense mutation subgroup. TP53MUT, TP53 mutated; TP53WT, TP53 wild‐type
