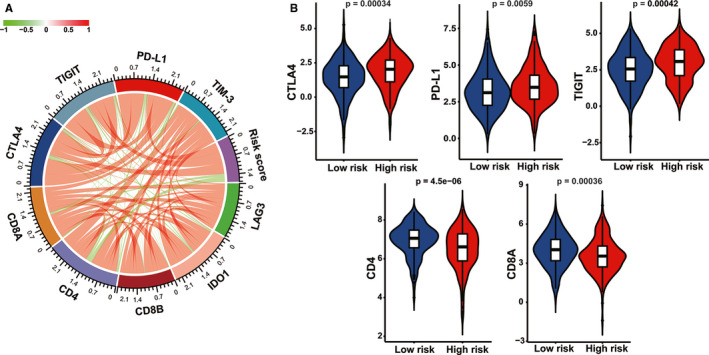
Figure 7.

Correlation analysis between the immune prognostic model (IPM) and pivotal immunotherapy‐associated moleculars. (A) Circular plot of the correlation between the IPM risk score and the expression of immune checkpoint regulators. (B) Violin plots of immunotherapy‐associated gene levels between high‐ and low‐risk early‐stage lung adenocarcinoma (LUAD) patients
