
Figure 8.
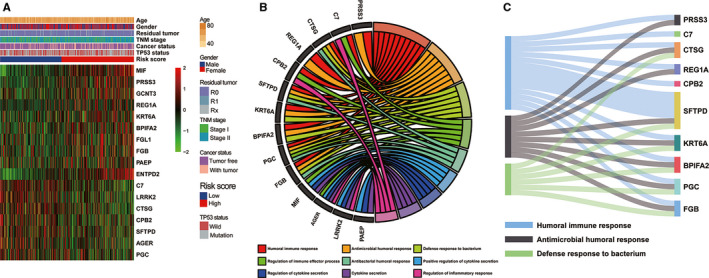
Functional analysis of the immune prognostic model (IPM). (A) Heatmap of risk score‐associated immune DEGs in early‐stage lung adenocarcinoma (LUAD) patients in the TCGA cohort. (B) Circular plot and (C) Sankey plot of the significantly biological pathways enriched in risk score‐associated immune DEGs. DEGs, differently expressed genes