FIGURE 3.

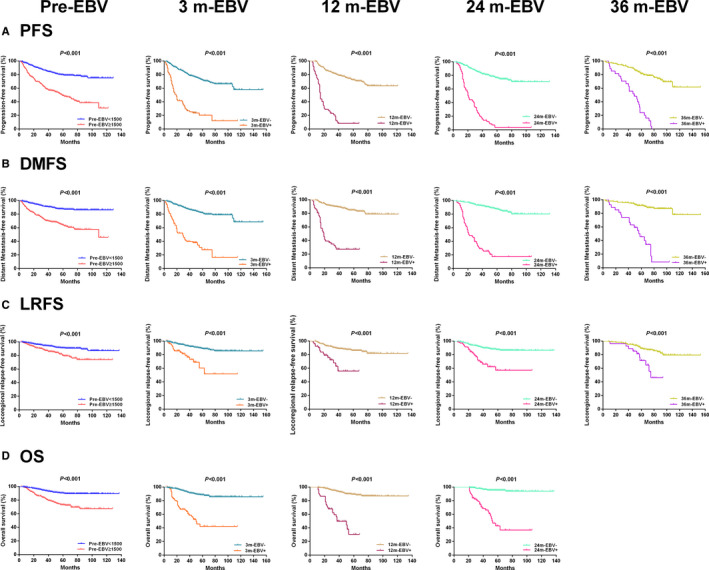
Kaplan‐Meier plots of survival outcomes for subgroups at different time points. (A) Progression‐free survival. (B) Distant metastasis‐free survival. (C) Locoregional relapse‐free survival. (D) Overall survival.

Kaplan‐Meier plots of survival outcomes for subgroups at different time points. (A) Progression‐free survival. (B) Distant metastasis‐free survival. (C) Locoregional relapse‐free survival. (D) Overall survival.