. 2021 Feb 9;20:281–296. doi: 10.17179/excli2020-3244

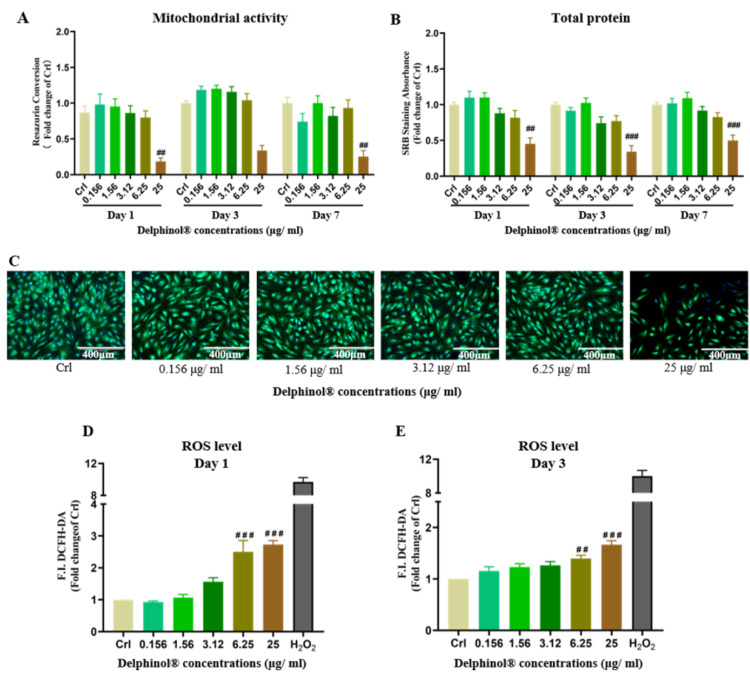
Figure 2. Effects of MBE on hOBs. (A) Measurement of the resazurin conversion of hOBs exposed to different concentrations of MBE on day 1, day 3, and day 7 of culture. (B) SRB staining of hOBs exposed to different concentrations of MBE on day 1, day 3, and day 7 of culture. Data are represented as mean ± SEM. Significance is determined as #p < 0.05, and ##p < 0.001 vs. Crl group. (C) Representative Calcein AM/Hoechst 33,342 staining microscopy images of hOBs exposed to different concentrations of MBE for 7 days. Red arrows indicate that hOBs had the highest cell viability when exposed to 1.56 μg/ml Delphinol®. (D) & (E). ROS level measurements of hOBs exposed to different concentrations of MBE on day 1 and 3 of culture. Data are represented as mean ± SEM, and the significance is determined as ##p < 0.01, and ###p < 0.001 vs. Crl group.

Figure 2