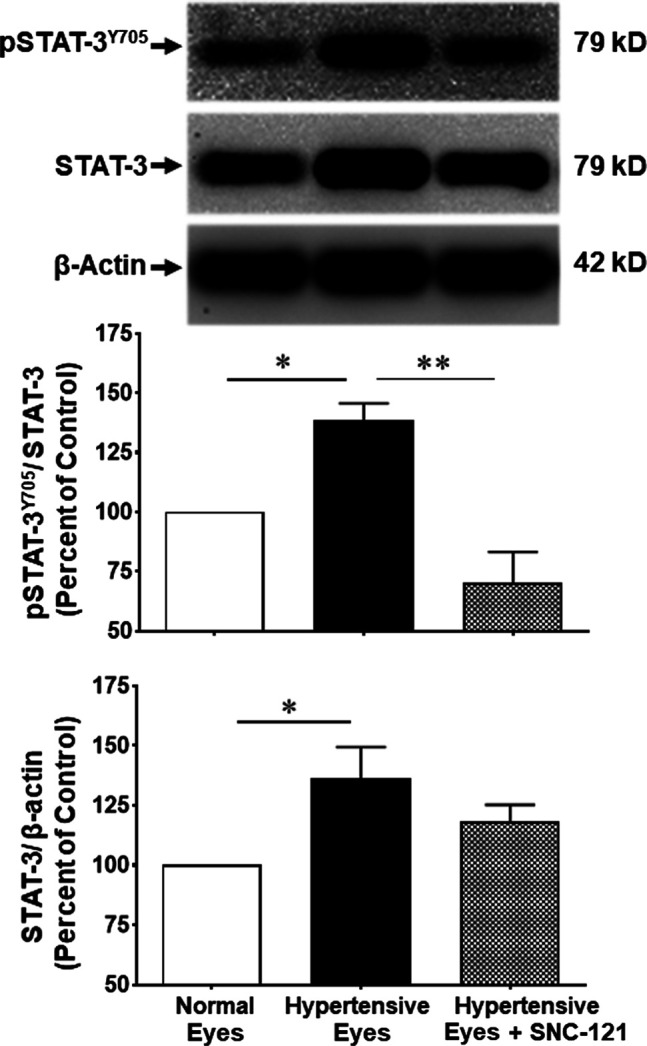
FIGURE 4.

Changes in the phosphorylation of STAT3 (Tyr 705) and total STAT3 by SNC-121 treatment in ocular hypertensive animals. The retina from normal, ocular hypertensive, and SNC-121 treated ocular hypertensive animals were collected at day 7, post hypertonic saline injection. Equivalent amount of retina protein extracts (20 μg) were analyzed by Western blotting using a selective anti-phosphoSTAT3 (Tyr 705), anti-STAT3, and anti-β-actin antibodies. The band intensities were measured using enhanced chemiluminescence reagent and Versadoc imaging system. Bar graph represents mean data ±SEM. OH Eyes; ocular hypertensive eyes; OH Eyes + SNC-121, ocular hypertensive eyes with SNC-121 treatment. *p < 0.05; ****p < 0.0001; n = 6–9. In this experiment “n” represent a biological replicate.
