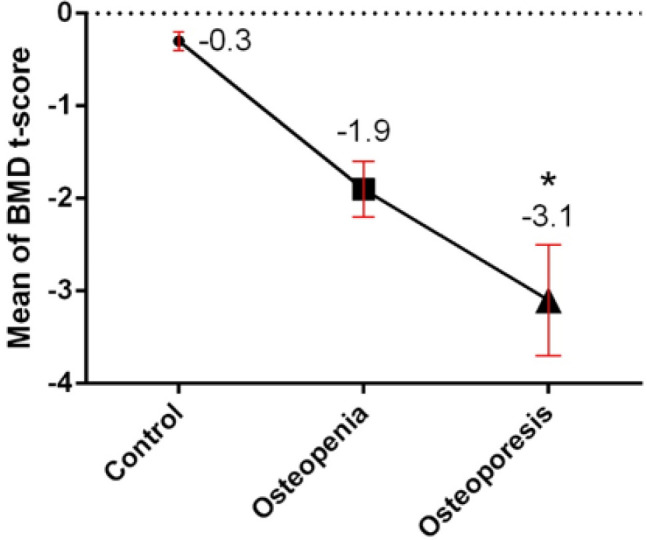
Fig. 1:

Illustrates mean of BMD T-score in the groups of the study. Normal: T-score of −1.0 or higher, osteopenia: between −1.0 and −2.5, and osteoporosis: −2.5 or lower, meaning a bone density that is two and a half standard deviations below the mean of a 30-year-old man/woman.
*, Statistically significant difference between control and patient groups (P ˂ 0.05).
BMD: Bone Mineral Density
