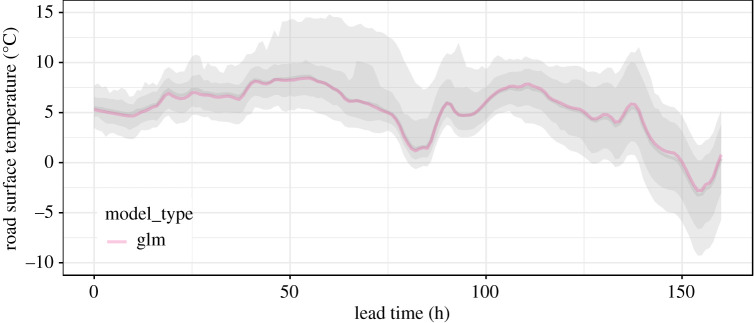
Figure 4.
A deterministic NWP forecast for that has been converted to a probabilistic forecast using equation (2.2). The 80% and 95% prediction intervals are shown as overlain grey ribbons, while the solid grey line is the median (which differs little from the NWP forecast here). (Online version in colour.)

