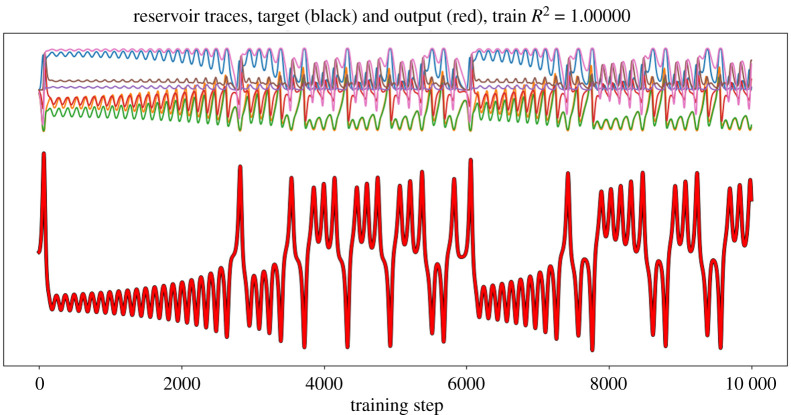
Figure 2.
Traces of activations of reservoir nodes over learning time for Lorenz 63. Top: Activation traces for a set ofrandomly selected reservoir nodes. Bottom: Evolution of the first state component through time (x1,t, black) and reconstruction of that state by linear combination ( computed estimated via Wout) of all the reservoir traces (red). The reconstruction is essentially perfect, with the red line coinciding exactly with the black one. (Online version in colour.)

