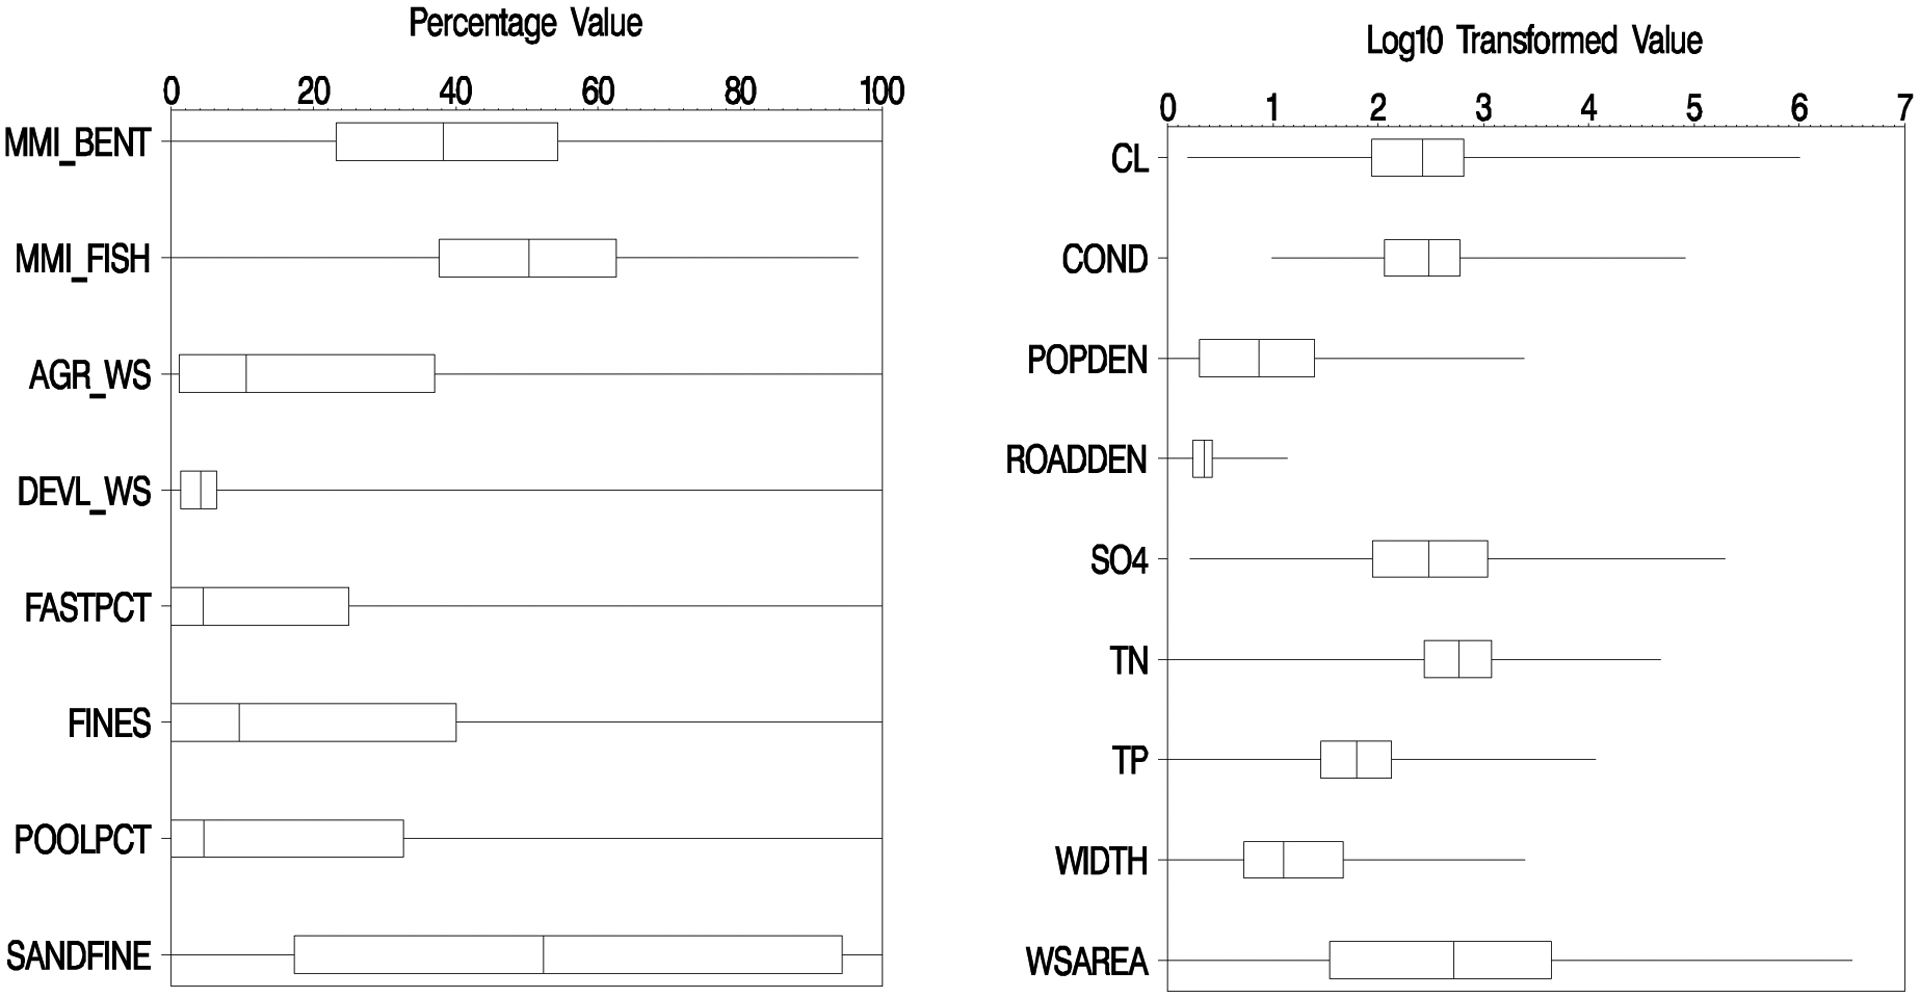
Figure 2.

Distribution of selected variables in the first-visit model data for fish and macroinvertebrate MMI scores and percentage-based variables; and log10-transformed variables. Boxes show the interquartile range, the line in the box is the median, and the whiskers show the minimum/maximum values. Full variable names, transforms, and units are given in Table 2.
