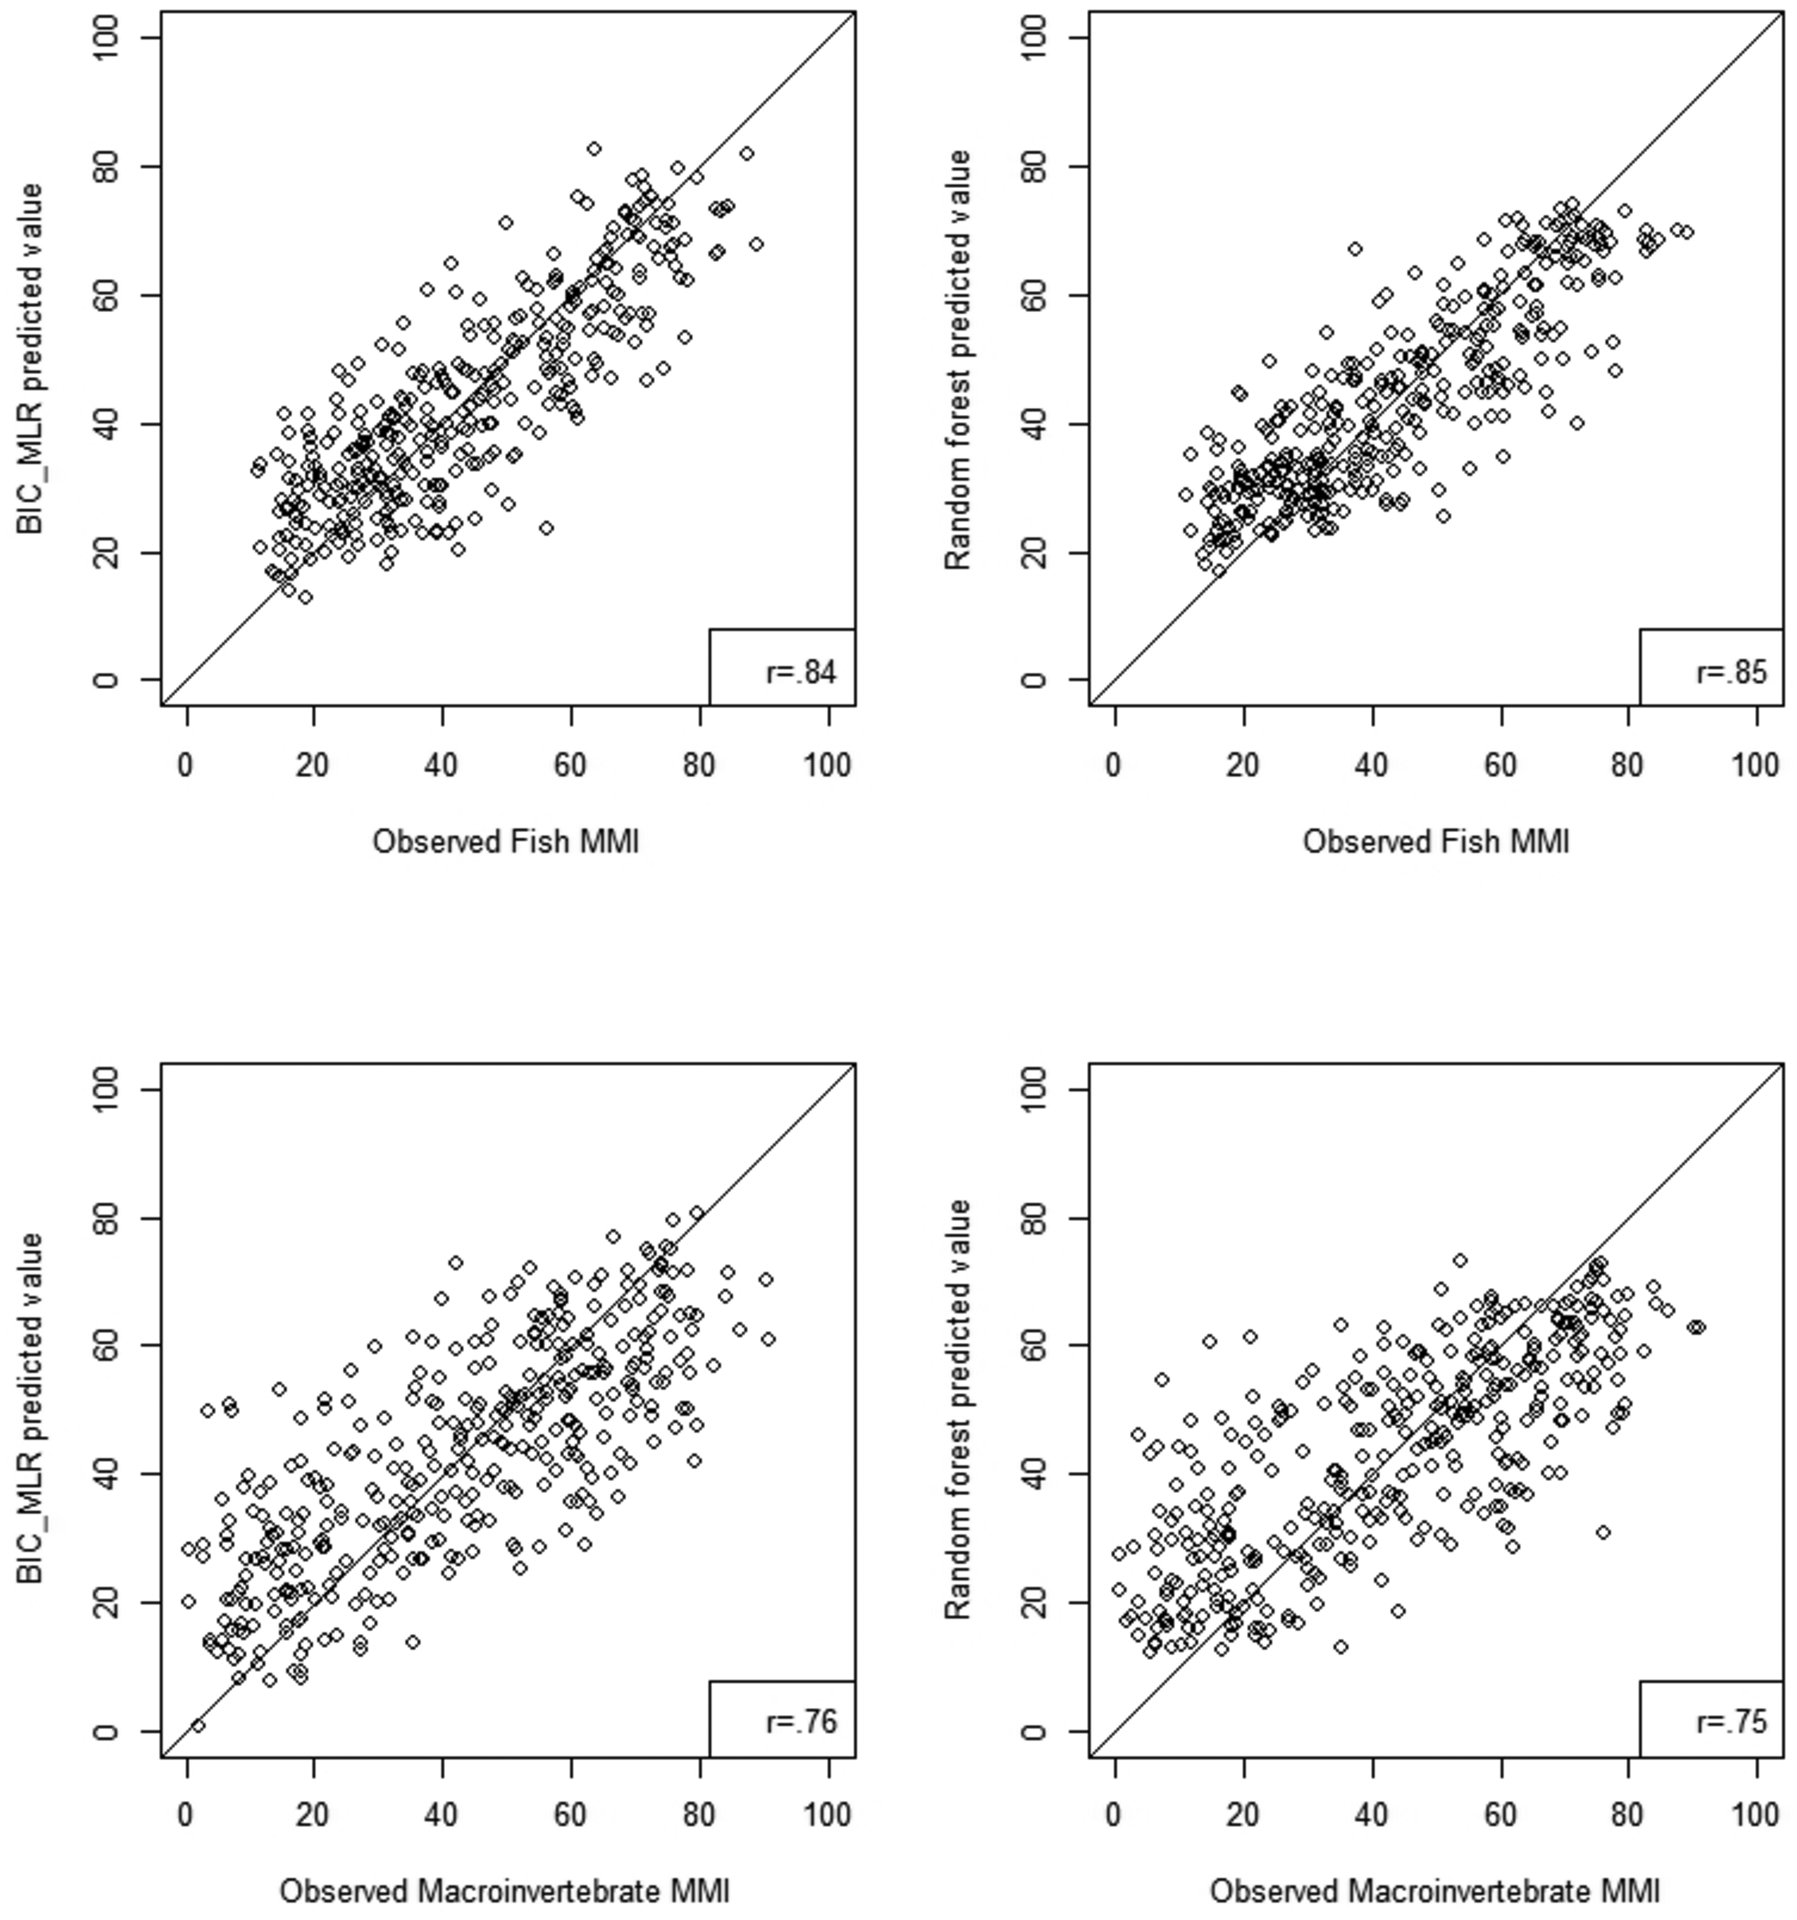
Figure 5.

Scatterplot comparison of Random Forest and BIC-MLR predicted fish and macroinvertebrate MMI scores to observed MMI scores in the Northern Appalachians ecoregion. The solid line is a 1:1 line and the r-value is the Pearson correlation coefficient of the scatterplot.
