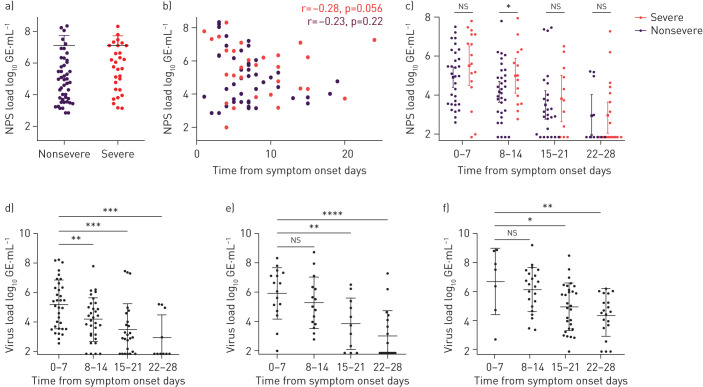
FIGURE 2.
Viral shedding dynamics of severe acute respiratory syndrome coronavirus 2 (SARS-CoV-2) by disease severity, sample type and time from symptom onset. NPS: nasopharyngeal swab; GE: genomic equivalents. a) Initial SARS-CoV-2 virus shedding load comparison in NPS samples according disease severity. b) Initial virus load according to time from symptom onset, with corresponding Pearson correlation. c) Comparison of virus shedding in NPS samples in patients with nonsevere and severe disease according to time from symptom onset. d, e) Dynamics of virus shedding in NPS samples of patients with d) nonsevere disease (n=51) and e) severe disease (n=41). f) Virus shedding dynamics measured exclusively in endotracheal aspirate of patients with severe disease (n=41). Nonsevere includes mild and moderate courses. Error bars indicate mean±sd. p-values were calculated with the t-test. *: p<0.05; **: p<0.01; ***: p<0.001; ****: p<0.0001; ns: nonsignificant. Supplementary table S2 shows corresponding statistical data.

