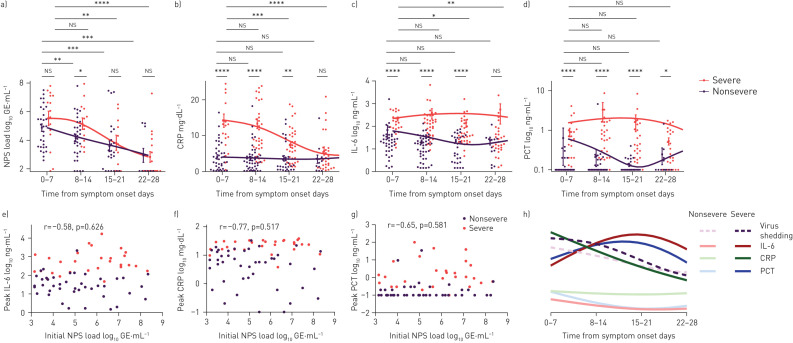
FIGURE 3.
Time-course of the inflammatory response in patients with nonsevere and severe disease. NPS: nasopharyngeal swab; GE: genomic equivalents; CRP: C-reactive protein; IL: interleukin; PCT: procalcitonin. a) Virus shedding in NPS samples, and serum measurements of b) CRP, c) IL-6 and d) PCT were plotted over time and grouped by disease severity. Mean±sd is indicated. e–g) Initial virus load (only NPS samples of spontaneously breathing patients at admission) was plotted against peak values of e) IL-6, f) CRP and g) PCT and the Pearson correlation was calculated. h) Representative overview of the longitudinal course of inflammatory parameters and virus shedding in NPS samples. For curve fitting, a spline with four knots was calculated. Error bars indicate mean±sem. The t-test was used to determined differences of means. *: p<0.05; **: p<0.01; ***: p<0.001; ****: p<0.0001; ns: nonsignificant. Supplementary table S3 shows corresponding statistical data.

