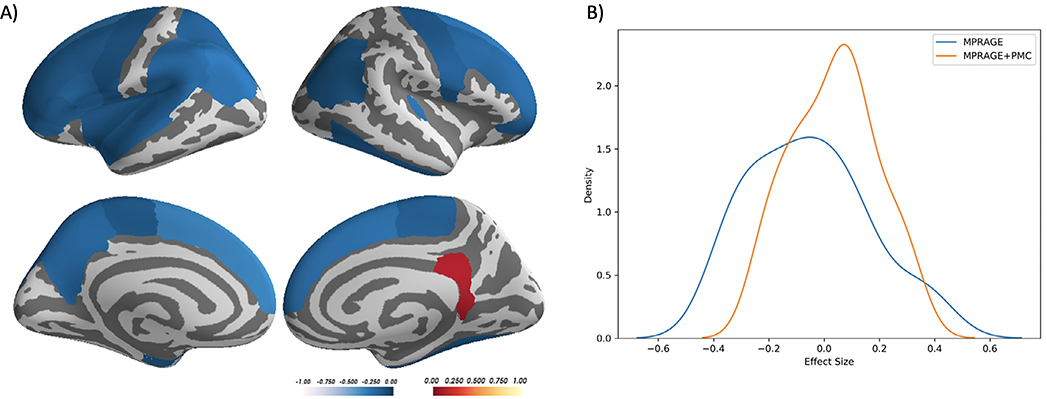
Fig. 6.
A) Desikan Atlas regions that showed a significant partial correlation (p<0.05), corrected by age and sex, between the difference in cortical thickness measurements (MPRAGE-MPRAGE+PMC) and mean FD across the functional scans. B) The distribution of the effect size (correlation of cortical thickness and motion estimates) across cortical regions for each sequence.

