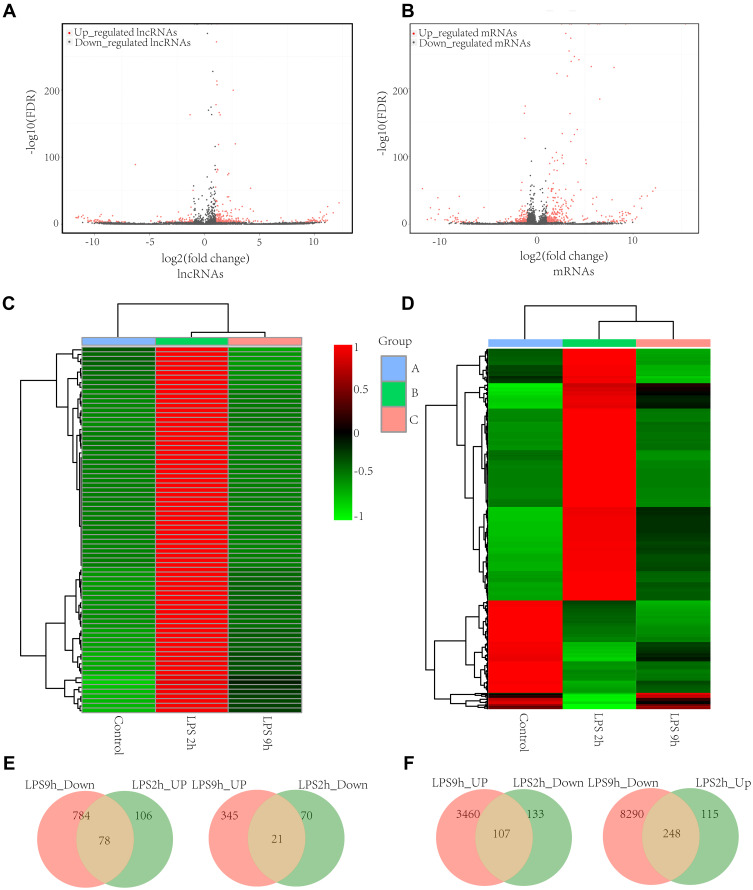
Figure 3.
The distinct lncRNA and mRNA expression profiles between LPS-induced AM and control AM. Volcano plots of differentially expressed lncRNAs (A) and mRNAs (B); The heatmap represents hierarchical clustering for differentially expressed lncRNAs (C) and mRNAs (D) at 0 h, 2h, and 9 h; lncRNAs (E) and mRNAs (F) that are significantly upregulated and downregulated at 2 h compared to 9 h. were shown by the Venn diagram between LPS-stimulated AM and control AM. The range of colors from green to red indicates expression value from relatively low to high, respectively (n=3 for the LPS-stimulated group and the control group, respectively).
Abbreviations: AM, alveolar macrophages; LPS, lipopolysaccharides.

