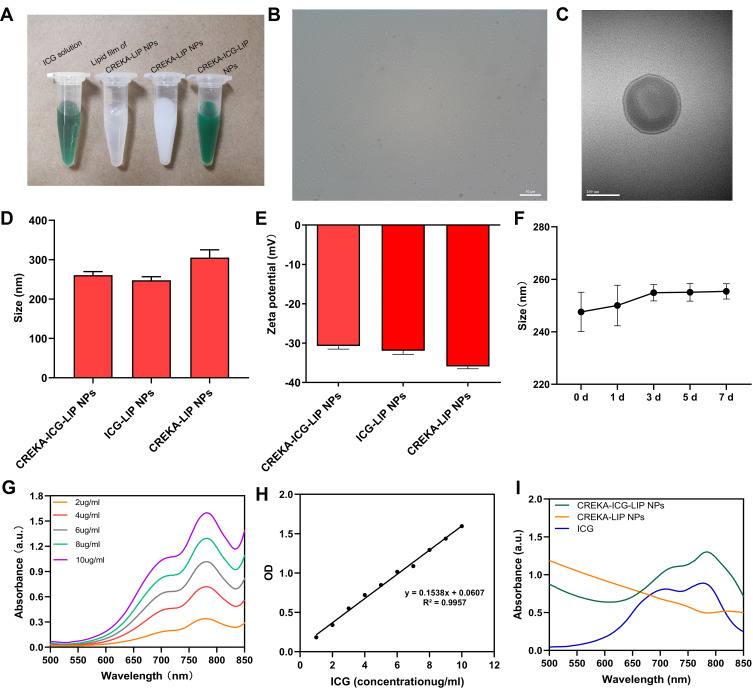
Figure 1.
Characterization of NPs. (A) Digital photos of ICG, the lipid film of CREKA-LIP NPs, CREKA-LIP NPs, and CREKA-ICG-LIP NPs solutions. (B) Optical microscopy image (scale bar = 10 um) and (C) TEM image (scale bar = 200 nm) of CREKA-ICG-LIP NPs. (D) Average size and (E) zeta potential of CREKA-ICG-LIP NPs, ICG-LIP NPs, and CREKA-LIP NPs. (F) Size of CREKA-ICG-LIP NPs at different time points (1 d, 3 d, 5 d, 7 d). (G) UV-vis-NIR spectra of ICG solution at different concentrations (2, 4, 6, 8, and 10 µg/mL). (H) Standard curve of ICG solution at 780 nm. (I) UV-vis-NIR spectra of ICG, CREKA-ICG-LIP NPs, and CREKA-LIP NPs.

