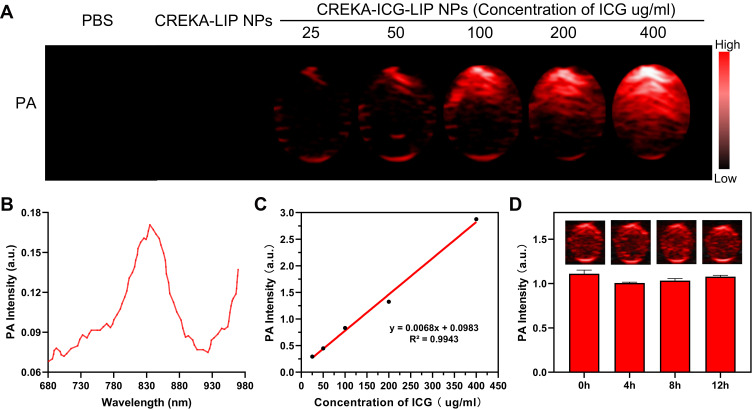
Figure 7.
PA imaging of NPs in vitro. (A) PA images of PBS, CREKA-LIP NPs (2 mg/mL), CREKA-ICG-LIP NPs (25, 50, 100, 200, 400 µg/mL ICG). (B) PA spectrum of CREKA-ICG-LIP NPs (25 µg/mL ICG) from 680 nm to 970 nm. (C) In vitro PA signal intensity with increasing ICG concentration in CREKA-ICG-LIP NP solution. (D) PA images (insert images) and quantitative analysis of PA signal intensity of CREKA-ICG-LIP NPs solution (200 µg/mL ICG) over time.

