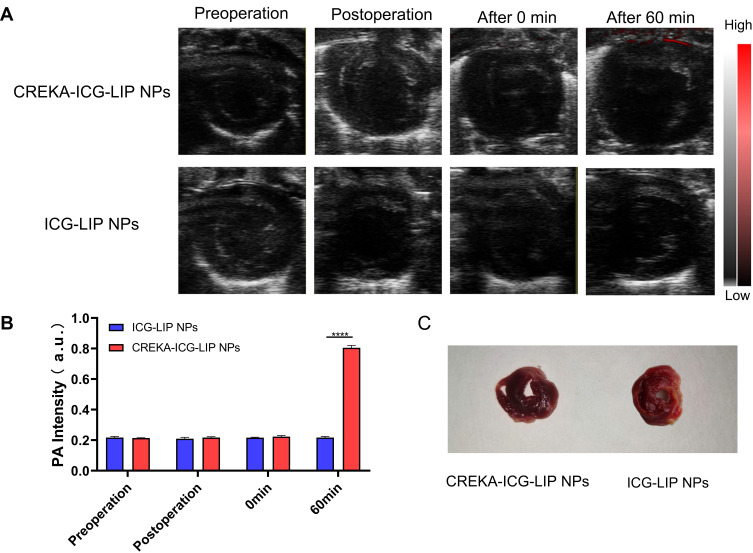
Figure 8.
PA imaging of NPs in vivo. (A) Merged US and PA images of the heart region. Images at different time points (preoperation, postoperation, 0 min after injection, 60 min after injection) after the injection of CREKA-ICG-LIP NPs solution and ICG-LIP NPs solution. (B) Corresponding quantitative analysis of the PA signal intensity values. ****p<0.0001. (C) TTC staining of myocardium in CREKA-ICG-LIP NPs group and ICG-LIP NPs group.

