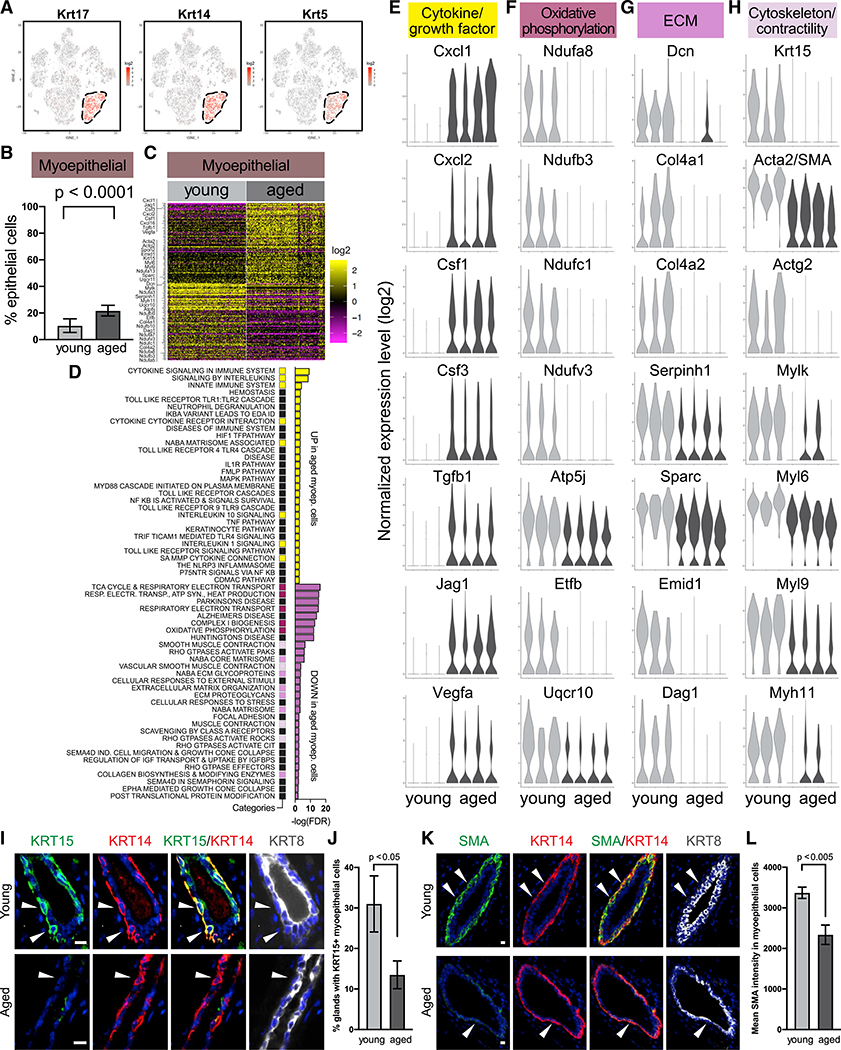
Figure 3. Aged Myoepithelial Cells Show Altered Gene Expression.
(A) Myoepithelial cells are identified by basal keratins in scRNA-seq data.
(B) Relative proportion of myoepithelial cells in young (n = 3) and aged (n = 4) mice by scRNA-seq (Fisher’s exact test).
(C) Differentially expressed genes in young versus aged myoepithelial cells. See also Table S3.
(D) Top gene sets identified by pathway analysis of differentially expressed genes in (C), with recurring gene sets highlighted. See also Table S4.
(E–H) Violin plots showing expression of select genes from (D).
(I–L) Representative immunofluorescence staining of KRT15 (I) and SMA (K) in myoepithelial cells (stained as KRT14+ and KRT8−, indicated by arrows). Scale bar, 10 μm. Quantifications are shown in (J) and (L), respectively (n = 6 mice per age group, Student’s t test).

