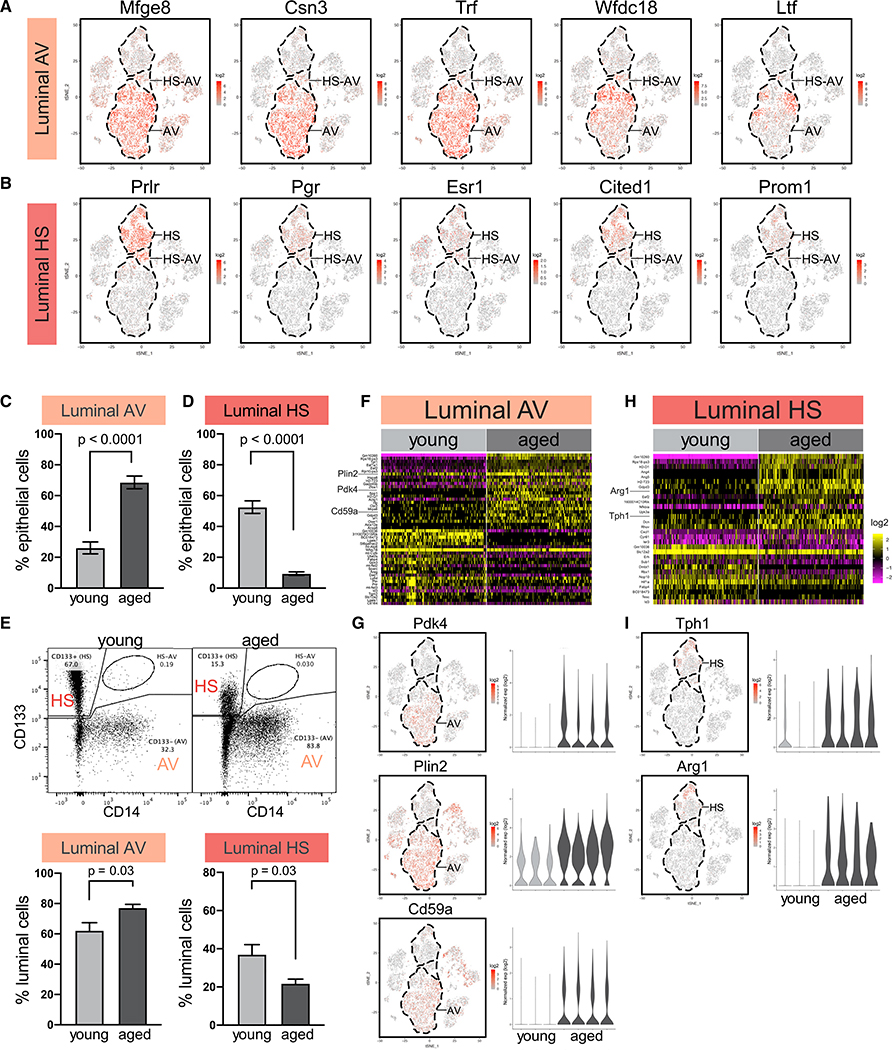
Figure 4. Alterations in Luminal Hormone-Sensing (HS) Cells and Alveolar (AV) Cells with Age.
(A) AV cells are distinguished by milk-related genes in scRNA-seq data.
(B) HS cells are distinguished by hormone receptors and canonical HS lineage markers.
(C and D) Relative proportion of AV (C) and HS (D) cells in young (n = 3) and aged (n = 4) mice by scRNA-seq (Fisher’s exact test).
(E) FACS analysis of relative abundance of AV cells and HS cells in young (n = 8) and aged (n = 6) mice. In the representative FACS plots, 10,000 cells are displayed. Statistical significance is determined by Student’s t test.
(F and G) Differentially expressed genes in young versus aged AV cells presented as heatmap (F) and specific examples (G). See also Table S3.
(H and I) Differentially expressed genes in young versus aged HS cells presented as heatmap (H) and specific examples (I). See also Table S3.

