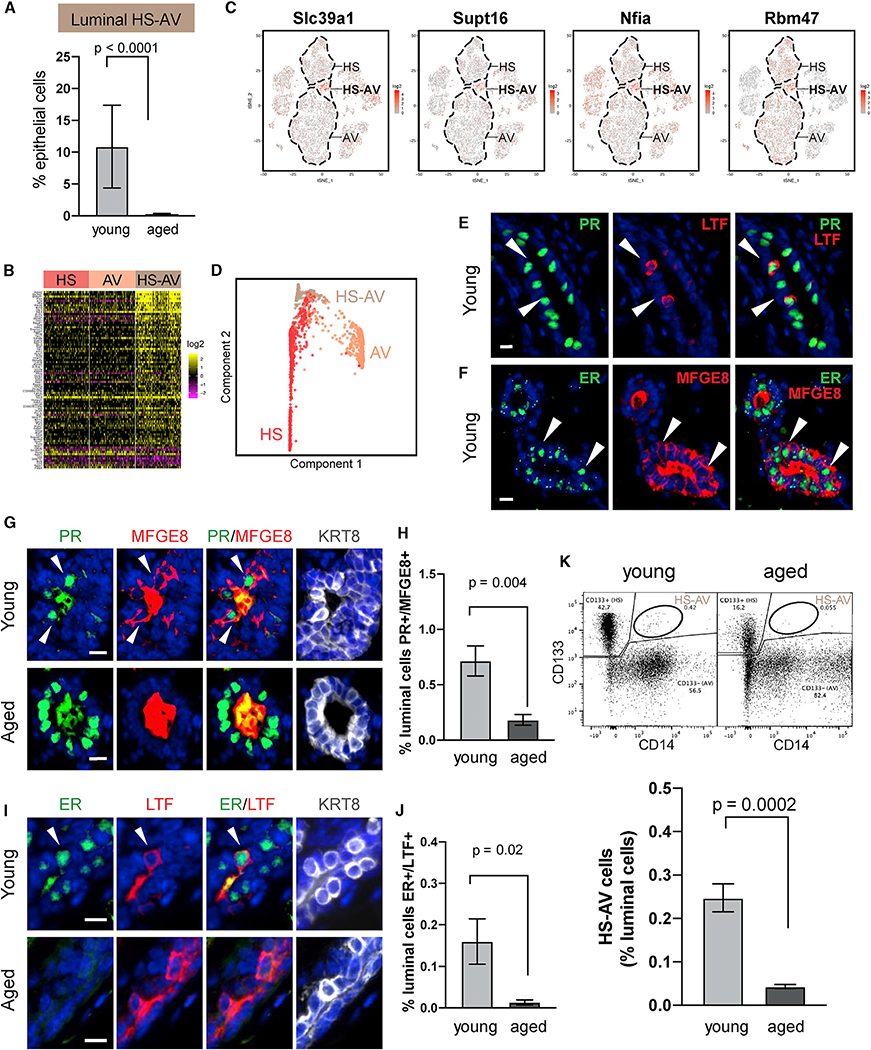
Figure 5. Luminal HS-AV Cells Show Age-Dependent Abundance.
(A) Relative proportion of HS-AV cells in young (n = 3) and aged (n = 4) mice by scRNA-seq (Fisher’s exact test).
(B) Markers distinguishing HS-AV cells from both HS cells and AV cells in young mice. See also Table S5.
(C) Expression pattern of select HS-AV markers in (B).
(D) Dimensionality reduction plot from STREAM lineage trajectory analysis of luminal cells in young mice (n = 3). See also Figure S5D.
(E and F) Representative immunofluorescence staining of HS-AV cells (indicated by arrows) co-expressing HS marker (PR or ER) and AV marker (LTF or MFGE8) in young mice.
(G–J) Immunofluorescence staining of HS-AV cells (indicated by arrows) co-expressing PR and MFGE8 (G) or ER and LTF (I) in young and aged mice. Scale bar, 10 μm. Quantifications are shown in (H) and (J), respectively (n = 6 mice per age group, Student’s t test). In (G) and (I), MFGE8 and LTF are also detected as secreted proteins in the lumen. KRT8 marks luminal cells.
(K) FACS quantification of HS-AV cells co-expressing HS marker CD133 and AV marker CD14 in an independent cohort of young (n = 8) and aged (n = 6) mice. In the representative FACS plots, 10,000 cells are displayed. Statistical significance is determined by Student’s t test.

