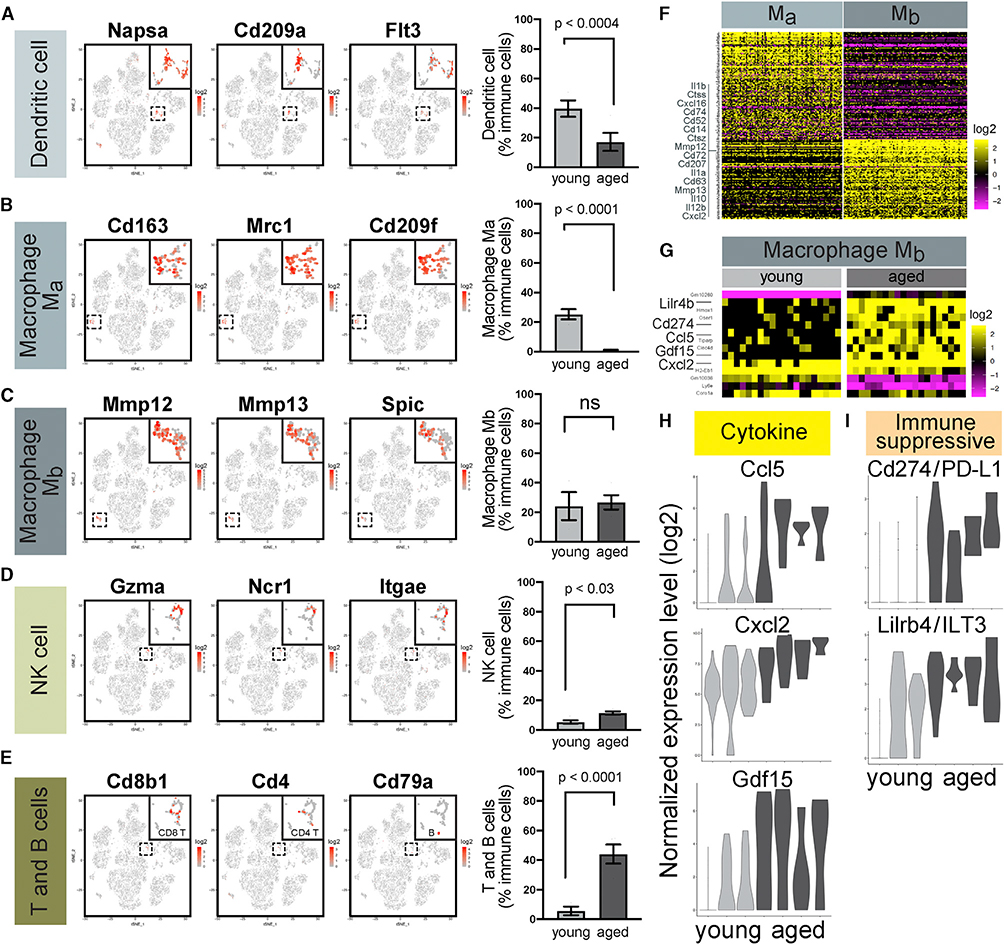
Figure 7. Age-Dependent Alterations in Myeloid and Lymphoid Immune Cells.
(A–E) Ma and Mb macrophages, dendritic cells, natural killer (NK) cells, and T and B cells, are distinguished by their respective markers in scRNA-seq data (left). Their relative abundance in young (n = 3) and aged (n = 4) mice are shown on the right (Fisher’s exact test).
(F) Genes distinguishing Ma and Mb macrophages. See also Table S6.
(G) Differentially expressed genes in young versus aged Mb macrophages. See also Table S3.
(H and I) Violin plots of cytokines (H) and immunosuppressive ligands (I) upregulated in aged Mb macrophages compared to young cells.

