Figure 9.

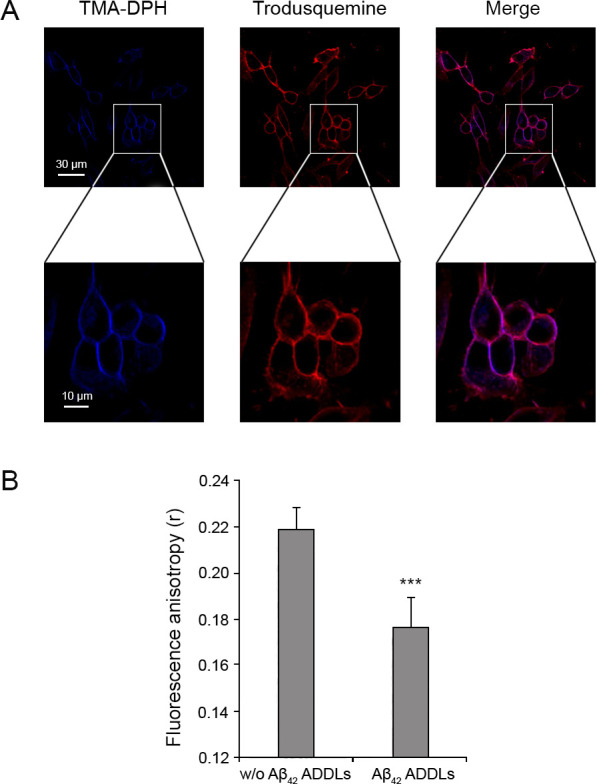
Incorporation of TMA-DPH in the SH-SY5Y cellular membrane and measurement of fluorescence anisotropy. (A) Representative confocal scanning microscopy images following the treatment for 5 min with 2.0 μM TMA-DPH and for 10 min with 5 μM trodusquemine labeled with Alexa Fluor 594. (B) Fluorescence anisotropy (r) of TMA-DPH obtained in the absence and presence of 1 μM (monomer equivalents) Aβ42 ADDLs oligomers. Data are represented as the mean ± SEM. The triple (∗∗∗) asterisks refer to p values of <0.001 relative to the results in the absence of oligomers.
