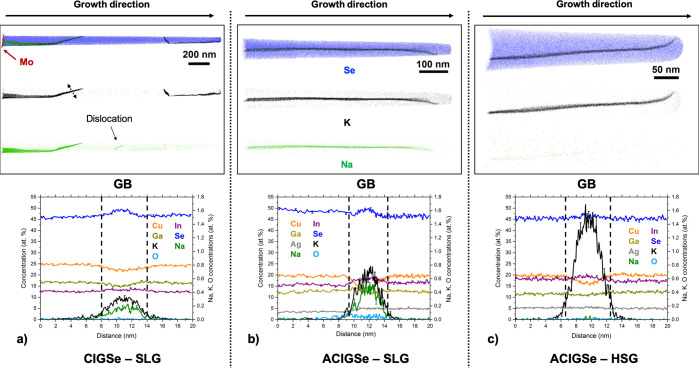
Figure 3.
APT analysis of GBs in the CIGSe (SLG) and both ACIGSe samples. 1D concentration profiles are shown below the respective reconstructions. The uppermost reconstructions show overlaid Se (blue), K (black), and Na (green) atoms, with individual reconstructions for alkalis shown separately below. (a) CIGSe grown on SLG (reference) showing four GBs in the absorber and a Na-decorated dislocation. Some GBs appear thicker because the GB planes are not parallel to the viewing direction. The 1D profile is measured across the GB highlighted by dotted arrows. (b) ACIGSe grown on SLG and (c) ACIGSe grown on HSG, both showing one GB per reconstruction.

