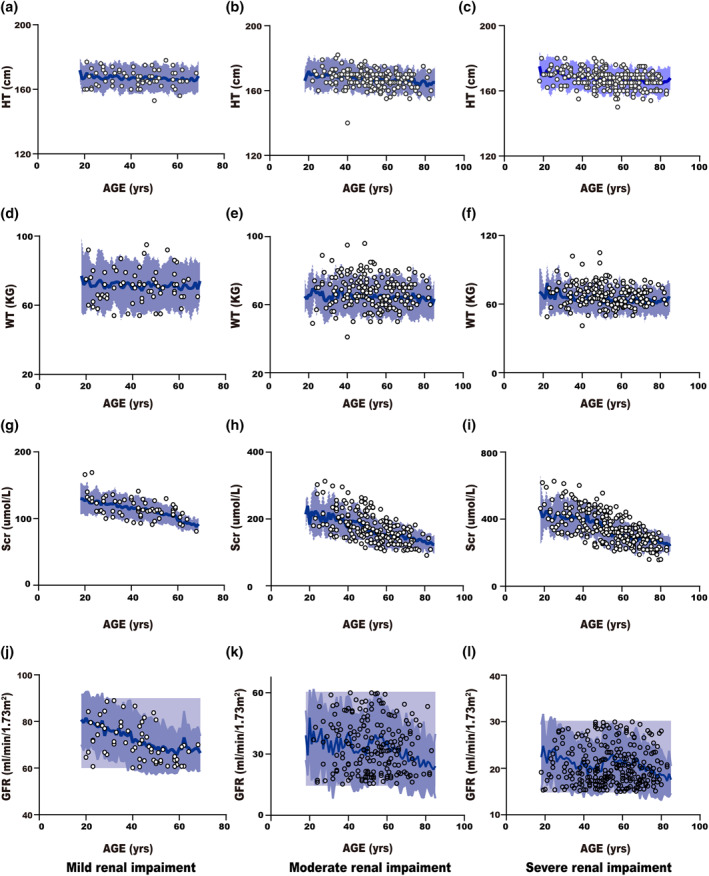
FIGURE 2.

Simulated versus observed body height, body weight, serum creatinine and glomerular filtration rate as a function of age in the Chinese male population with various levels of renal impairment. The blue area represents a 90% confidence interval from 2000 virtual individuals simulated in physiologically based pharmacokinetic population models and the solid blue line represents mean values. Black rings represent observed values from the public data (Hu et al., 2019) study database
