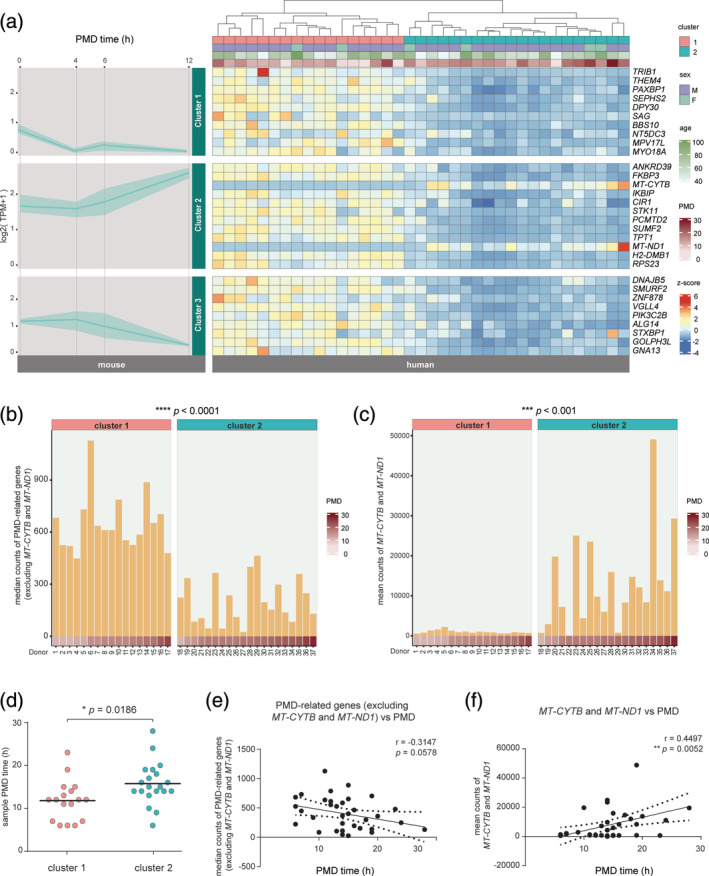
FIGURE 3.

The effects of postmortem delay (PMD) on the human microglia transcriptome. (a) Line and ribbon graphs depict expression pattern of mouse genes with a human homologue, divided into three gene clusters that were previously identified in mouse microglia (left). The y‐axis indicates expression values, and postmortem time is depicted on the x‐axis. The line depicts the mean expression values of the genes in their respective cluster, the ribbon illustrates the highest and lowest gene expression values of the given PMD. A heatmap of 31 human homologs of PMD‐related genes identified in mouse (right). Human samples clustered into two groups based on the relative gene expression of PMD‐related homologs. (b,c) Bar plots depicting the median gene expression of PMD‐related genes excluding MT‐CYTB and MT‐ND1 (b) and mean expression of MT‐CYTB and MT‐ND1 (c) for each individual human sample. The PMD for each human sample is indicated. An unpaired t‐test was performed to assess significance. ***, p < .001; ****, p < .0001. (d) Dot plot depicting the PMD time of the samples in Cluster 1 and 2. An unpaired t‐test was used to determine the significance *, p < .05. (e, f) Linear regression analysis for median counts of PMD‐related genes excluding MT‐CYTB and MT‐ND1 (e) and mean counts of MT‐CYTB and MT‐ND1 (f) to PMD time. Results show linear regression lines with 95% confidence limits and Pearson r values with p values indicating degree of significance. **, p < .01
