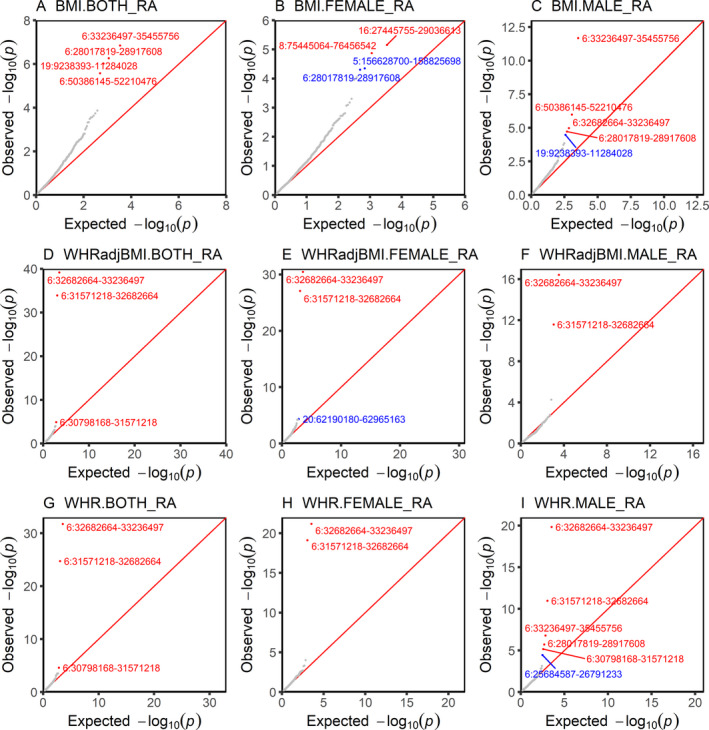
Figure 2.

Local genetic correlation between obesity‐related traits and rheumatoid arthritis (RA). Plots show region‐specific P values for the local genetic covariance between RA and body mass index (BMI), waist‐to‐hip ratio (WHR), and WHR adjusted for BMI (WHRadjBMI) overall (both) and in female and male subjects analyzed separately. Each dot presents a specific genomic region. Red indicates significance after multiple corrections (P < 3 × 10⁻⁵ [0.05/1,703 regions compared]); blue indicates nominal significance under an arbitrary threshold of P < 5 × 10⁻⁵.
