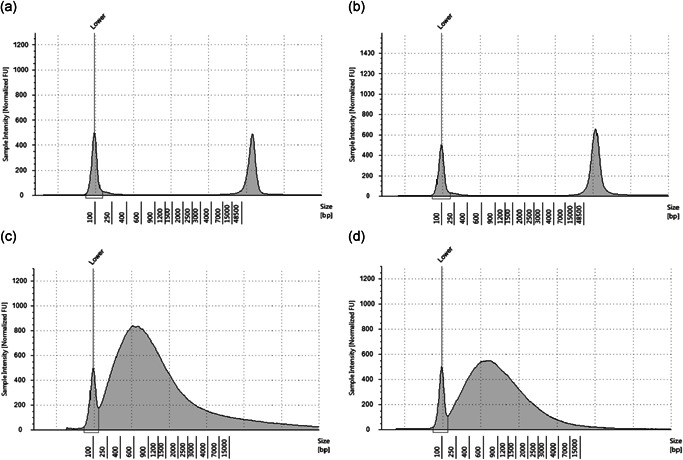
Figure 2.

Comparison of genomic DNA quality using TapeStation 2200. Electropherograms of gDNA from FF‐CT (a), FF‐NT (b), FFPE‐CT (c), and FFPE‐NT (d). The x‐axis and the y‐axis represent the fragment size (bp) of gDNA and sample intensity (normalized FU), respectively. FF‐CT, fresh‐frozen cancer tissue; FF‐NT, fresh‐frozen non‐cancer tissue; FFPE‐CT, formalin‐fixed paraffin‐embedded cancer tissue; FFPE‐NT, formalin‐fixed paraffin‐embedded non‐cancer tissue.
