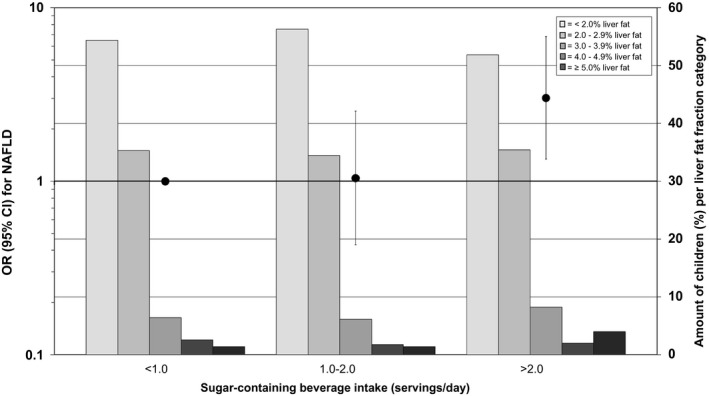
FIG. 3.

Associations between sugar‐containing beverage intake in infancy and odds of NAFLD in school‐aged children. The black circles represent ORs (95% CIs) that reflect the risk of NAFLD per sugar‐containing beverage intake category in infancy as compared with the reference group (children with less than one serving per day intake of sugar‐containing beverage), as scaled on the left y‐axis. These associations are adjusted for children at 10 years of age, sex, total energy intake, maternal prepregnancy BMI, education, net household income, child ethnicity, physical activity, and screen time. The bars present the amount of children (as a percentage) per liver fat fraction categories (< 2.0%, 2.0%‐2.9%, 3.0%‐3.9%, 4.0%‐4.9%, and ≥5.0% liver fat) per sugar‐containing beverage intake, as scaled on the right y‐axis. Trend: OR, 1.73 (95% CI, 1.12‐2.66) per one‐serving‐per‐day increase in sugar‐containing beverage intake.
