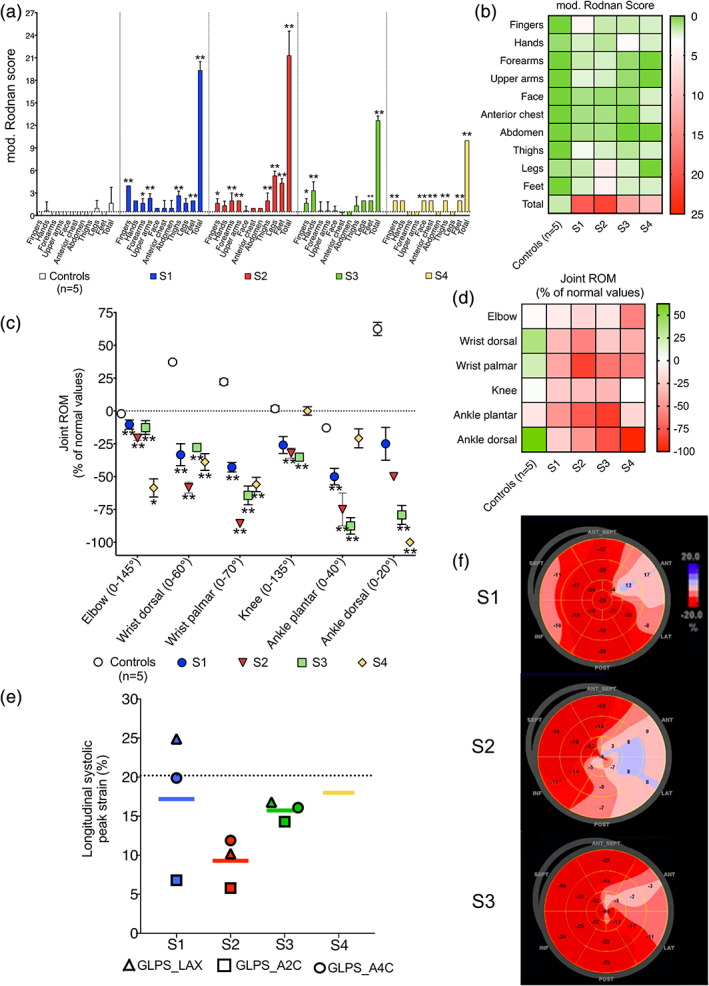
FIGURE 1.

(a) Rodnan score at each skin site in subjects S1, S2, S3, S4 and controls (n = 5). (b) Heatmap for Rodnan score at each skin site and total score in each individual and controls. (c) Joint range of motion (ROM) at the elbow, wrist, knee and ankle in S1, S2, S3, S4 and controls (n = 5). Normal range from Luttgen and Hamilton (Luttgens & Hamilton, 1997) are reported in parenthesis. (d) Heatmap of joint ROM for each patient and controls at different sites. (e) Average global longitudinal systolic peak strain (GLPS). Dashed line indicates average value in controls, that in children corresponds to 20.2 ± 0.7% and in adults to 20.2 ± 1.6%. (f) Heart walls divided into 17 segments and segmental strain measurements were plotted in a bull's eye and left ventricular global longitudinal strain based on all three apical views was calculated. For S4, only average GLPS was available. GLPS, global longitudinal systolic peak strain; GLPS_LAX, long axis view; GLPS_A2C, apical 2 chambers view; GLPS_A4C, apical four chambers view [Color figure can be viewed at wileyonlinelibrary.com]
