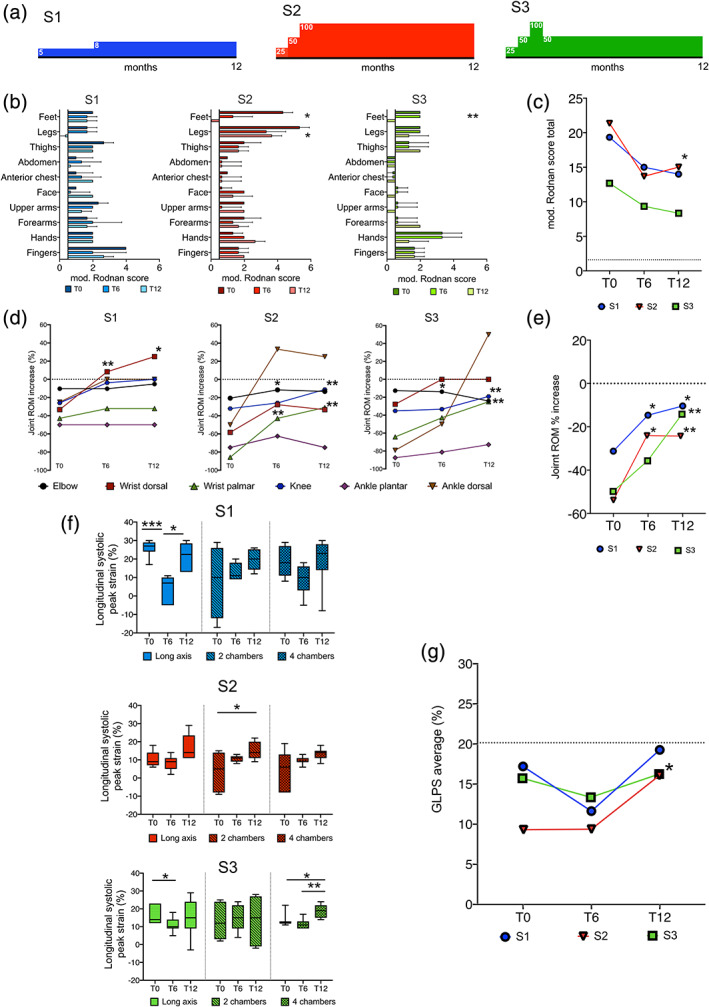
FIGURE 2.

(a) Subjects S1 (blue), S2 (red), S3 (green) were treated with losartan for 12 months and the dose was titrated according to blood pressure levels (numbers in boxes indicate mg per day). (b,c) Modified Rodnan scores evaluated at baseline (T0) and after 6 (T6) and 12 (T12) months of treatment with losartan in subjects S1, S2, and S3. Single sites (b) andglobal (c) scores are shown. Dashed lines (c) indicate average total score detected in controls (n =5). (D,E) Joint ROM in three MS subjects at baseline (T0) and after 6 (T6) and 12 (T12) months of treatment. Single sites (d) and average scores (e) are shown. The dashed line (d, e) indicates average value in controls. (f, g) Apical views (long axis, two chambers, four chambers; f) and average global longitudinal systolic peak strain (GLPS; g) in three subjects after 6 and 12 months of treatment with losartan. The dashed line indicates the average value in controls: GLPS average normal values in children is 20.2 ± 0.7% and in adults is 20.2 ± 1.6%. ANOVA and Kruskal–Wallis rank sum test have been used for significance calculation, *p < .05, **p < .01 [Color figure can be viewed at wileyonlinelibrary.com]
