Figure 2.

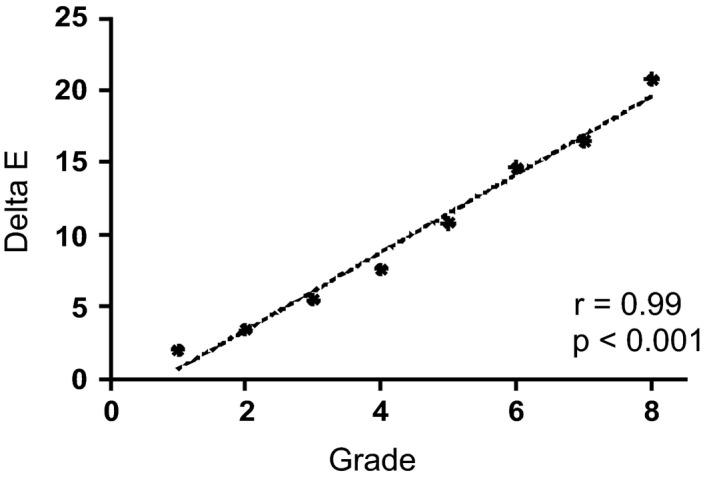
Delta E (ΔE) values, calculated by comparing the colour of the infraorbital and cheek bone ROIs, plotted against grades. (r = Person’s correlation coefficient; with correspondingPvalue).

Delta E (ΔE) values, calculated by comparing the colour of the infraorbital and cheek bone ROIs, plotted against grades. (r = Person’s correlation coefficient; with correspondingPvalue).