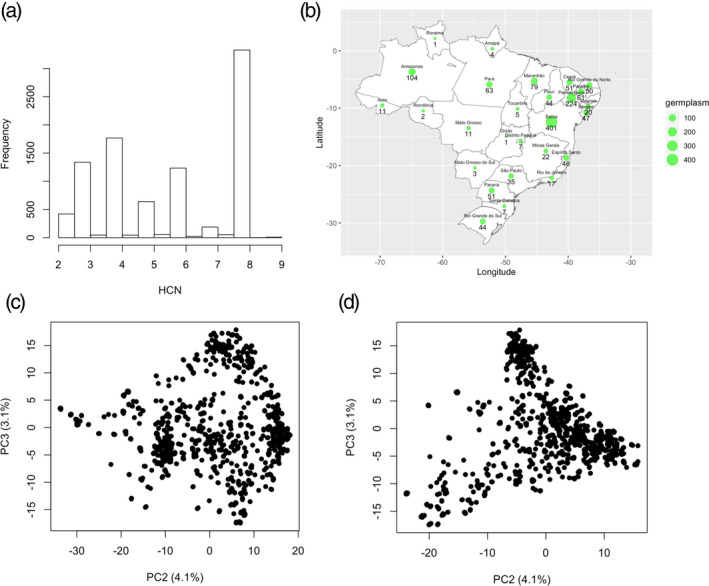
Figure 1.

Geographic distribution and population structure of Latin American (Brazilian) germplasm. (a) Distribution of assayed HCN. HCN assayed phenotype score ranges from 2 to 9. (b) Distribution of germplasm based Brazilian states. A total of 1,821 cassava accessions have valid geographic information. The green dots show where the accessions come from while the size of the dots represent the number of clones from that state. The black numbers show how many accessions were sampled from each location. Population structure reveals the first three axis of the principal component analysis (PCA) explains about 15.3% of the variations in the population of 1246 individuals, 9,686 SNPs after filtering for Hardy–Weinberg equilibrium and LD of 0.01 and 0.2 respectively. (c) shows the first and third axis, while (d) shows the second and the third axis.
