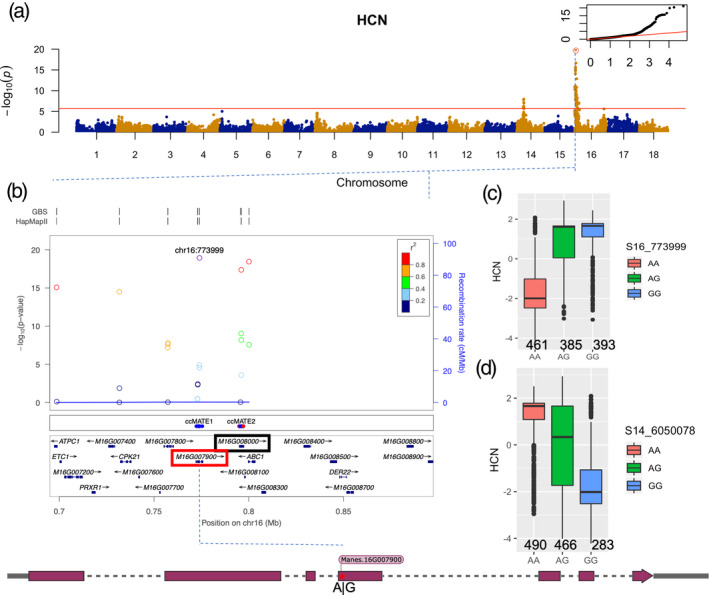
Figure 2.

Genome‐wide association study (GWAS) of HCN for Latin American (LA) germplasm. (a) Manhattan plot from a mixed linear model (MLM‐LOCO) with the chromosome on which the candidate SNP is located excluded from calculating the genetic relationship matrix (GRM). The Bonferroni significance threshold is shown in red. A quantile–quantile plot is inserted to demonstrate the observed and expected −log10 P for HCN. The red circle indicates the candidate SNP. (b) locuszoom plot showing the HCN chromosome 16‐associated region (−log10 P) around the candidate gene. The two rows above the plot show genomic coverage at the locus, with each vertical tick representing direct genotyping from GBS and HapMap single‐nucleotide polymorphisms (SNPs). Each circle represents an SNP, with the color of the circle indicating the correlation between that SNP and the candidate SNP at the locus (purple). Light‐blue lines indicate the estimated recombination rate (hot spots) in GBS. The middle panel shows 36 single point mutations (red are deleterious) between the region spanning ccMATE1 and ccMATE2. The bottom panel shows the annotated genes at each locus in cassava genome version 6.1. The red and black rectangles indicate Manes.16G007900 and Manes.16G008000, respectively, with a Pearson correlation coefficient of 0.96 (r 2) between both genes. The scheme presents the gene model, with the position of the associated SNP within the 4th exon indicated. (c and d) Box plots showing candidate SNP effects for HCN between each genotype class for the top markers, S14_6050078 and S16_773999, respectively.
