
Figure 5.
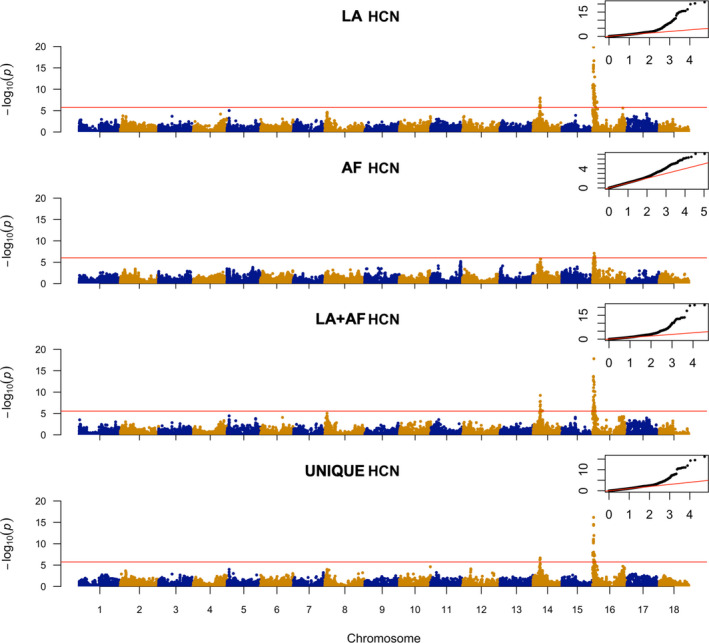
Manhattan plot from a mixed linear model (MLM‐LOCO) with the chromosome on which the candidate SNP is located excluded from calculating the genetic relationship matrix (GRM). The MLM‐LOCO summarizes the genome‐wide association results for HCN in Latin American (LA, Brazilian), African (AF), joint Latin American + African (LA + AF) and unique Latin American (UNIQUE LA) germplasms. Bonferroni significance threshold is shown in red. A quantile–quantile plot is inserted to demonstrate the observed and expected −log10 P for HCN.