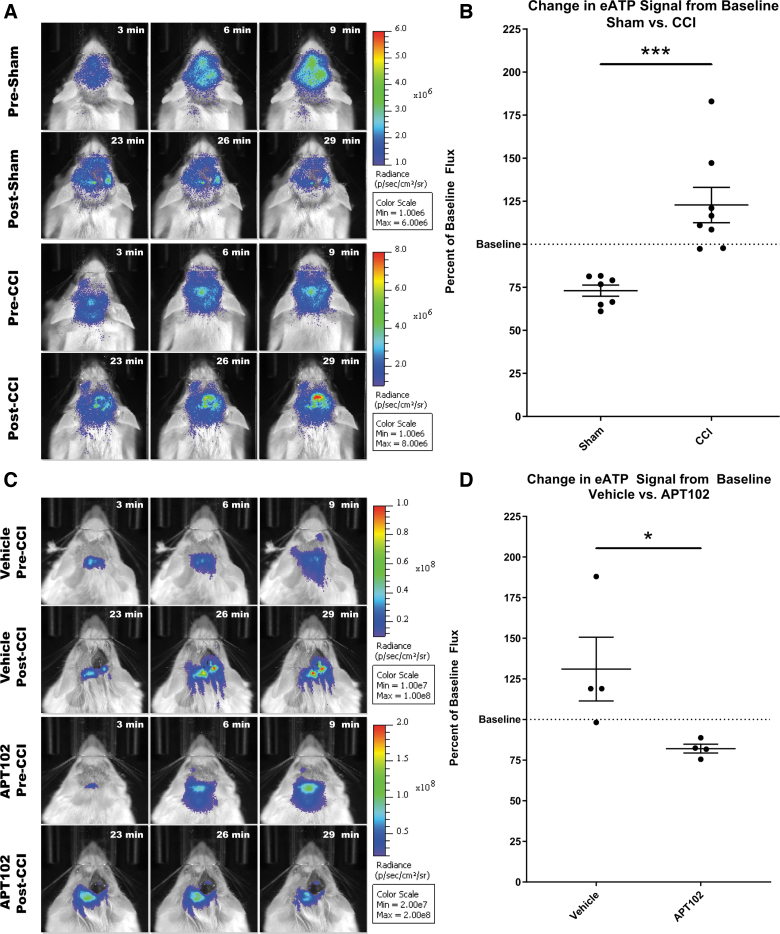
FIG. 3.
Monitoring eATP changes in pmeLUC-CCI model. (A) Representative images of IVIS imaging before and after CCI surgery. First and third rows (pre-sham or pre-CCI) represent three time points during the baseline acquisition period (pre-surgery), showing a gradual increase in ATP signal. Second and fourth rows (post-surgery) represent three time points taken after surgery. Increased signal is present at the site of impact in CCI animals. (B) Comparison of bioluminescence signal post-surgery shows a significant difference in eATP levels between sham (n = 7) and CCI (n = 8) groups (p = 0.0008; unpaired t test). (C) APT102 apyrase treatment prevents increase in pmeLUC activity. Representative image of vehicle- and APT102-treated animals before and after CCI surgery. (D) Comparison of bioluminescent signal shows a significant difference between vehicle- (n = 4) and apyrase-treated (n = 4) animals receiving CCI (p = 0.0483; unpaired t test). ATP, adenosine triphosphate; CCI, controlled cortical impact; eATP, extracellular ATP; IVIS, in vivo imaging system; Max, maximum; Min, minimum.

