
Figure 2. SNP and FISH Analyses of GC Deletion.
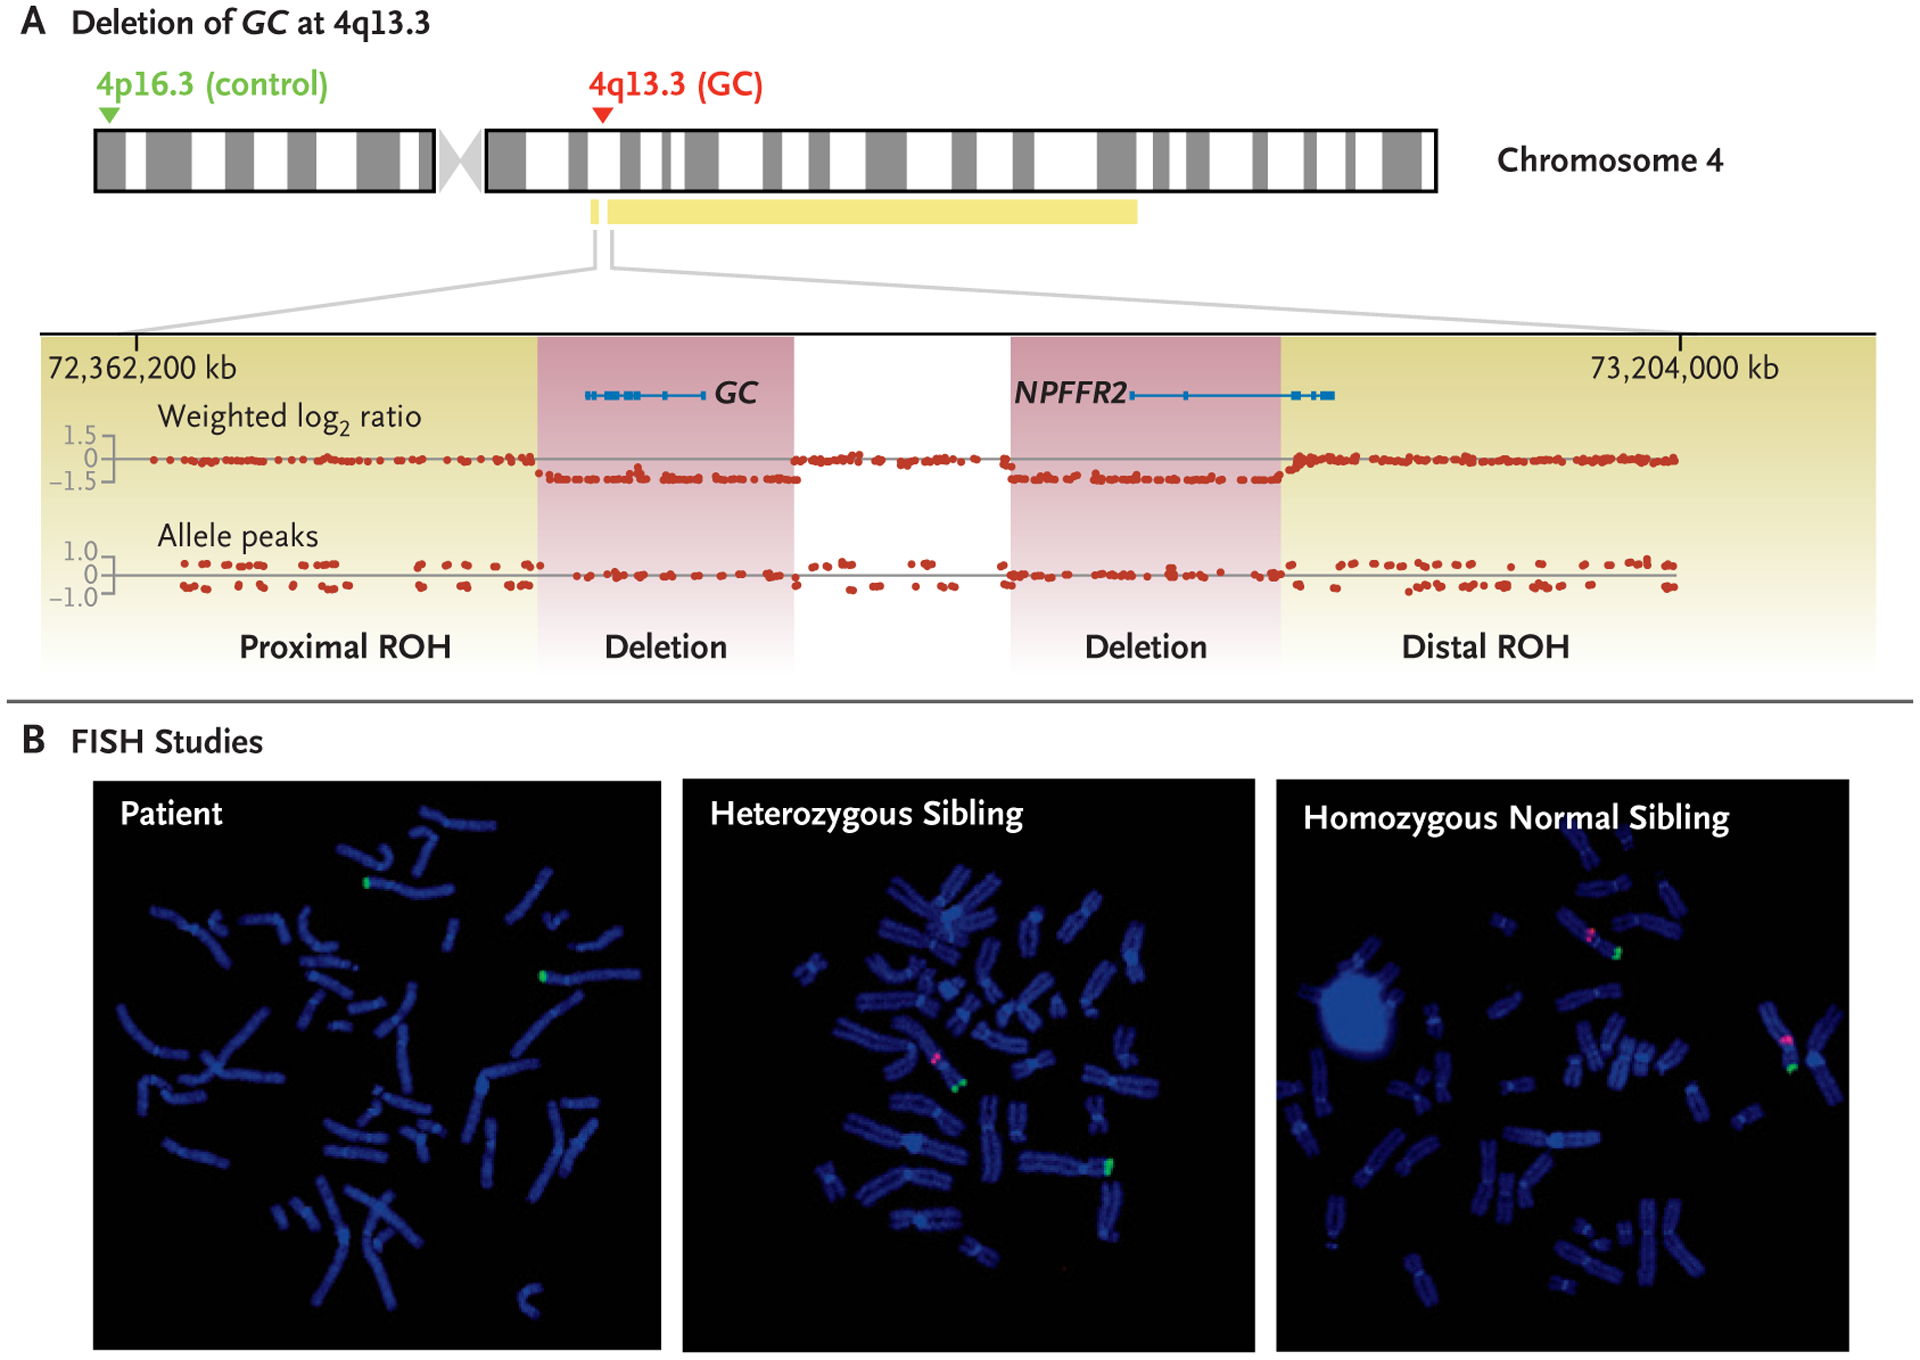
Panel A shows results of single-nucleotide polymorphism (SNP) microarray for the patient. With the use of human genome assembly hg19, homozygous deletions of the group-specific component (GC) gene and part of the neuropeptide FF receptor 2 (NPFFR2) gene are shown on chromosome 4 at 4q13.3, spanning base pairs 72,581,969 to 72,720,986 and 72,839,592 to 72,984,080, respectively. The deletions, shown in purple and separated by an undeleted segment, are flanked by a small proximal 1.13-Mb region of homozygosity (71,449,909 to 72,575,787) and a large distal 66-Mb region of homozygosity (72,991,367 to 139,320,224), shown in yellow and denoted as ROH. The absence of allele peaks is consistent with homozygous deletions. The probes used for metaphase fluorescence in situ hybridization (FISH) are shown with the 4p16.3 control probe RP11–980G14 in green and the 4q13.3 GC probe G24P83578B9 in red. Panel B shows the results of FISH for the patient (left), a heterozygous sibling (middle), and a homozygous normal sibling (right).