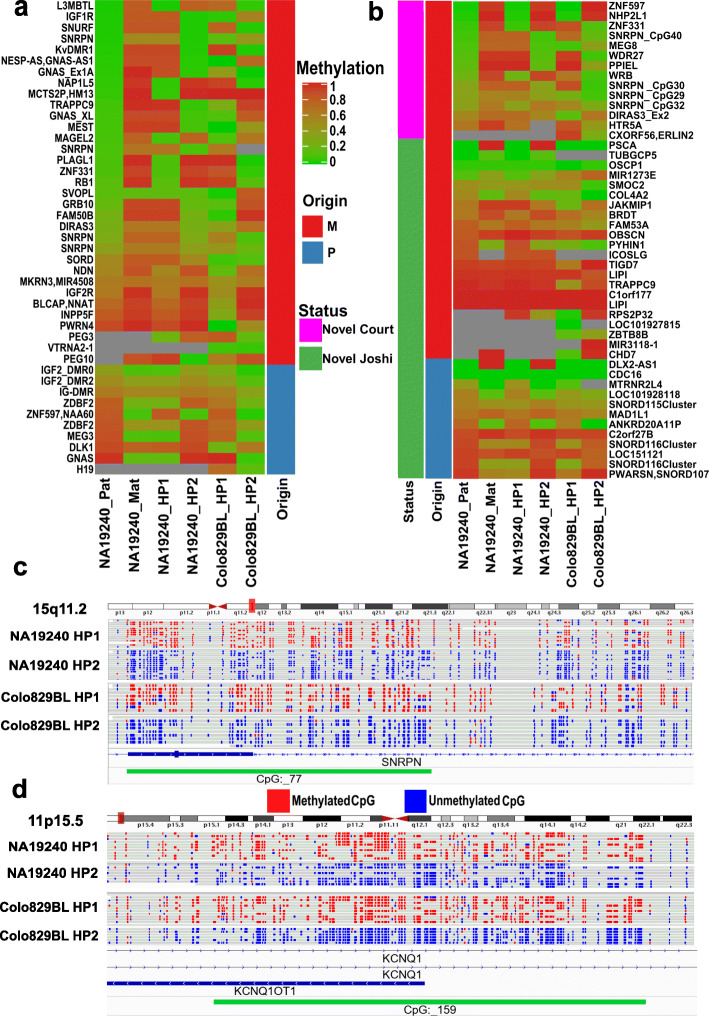
Fig. 4.
Methylation levels and phased CpGs at human ICRs. a, b Methylation levels of phased CpGs presented with haplotypes of origin at reported ICRs as heatmaps. a CpGs mapped to known ICRs. b CpGs mapped to novel ICRs from Court et al. and Joshi et al. The heatmap colors represent the mean of methylation at the regions. Origin bar indicates known or reported origin from previous studies, and heatmap column labels represent assigned haplotype by NanoMethPhase. In trio phasing, Pat stands for paternal and Mat for maternal. c, d Integrative Genomics Viewer screen captures of phased bam files converted to mock WGBS format for samples NA19240 run 1 and Colo829BL at two well-known ICRs

